Every few days, a pair of European satellites quietly photographs the entire land surface of the planet. They are called Sentinel-2; they orbit about 786 kilometers up, and they see the world in colors our eyes can’t — near-infrared, red-edge, shortwave bands that reveal how vigorously a forest is growing or how wet a field is. The data is free, it’s open, and there is an almost absurd amount of it.
The problem is that “an enormous pile of free satellite imagery” is not the same thing as “something a machine can learn from.” Raw imagery is just numbers. To train models that recognize crops, map cities, detect deforestation, or describe a landscape in plain language, you need that imagery cut, cleaned, labeled, and split into training and testing sets.
That gap is the reason I spent much of the past year developing SENSERO in collaboration with my colleagues at the GeoSense lab
What SENSERO actually is
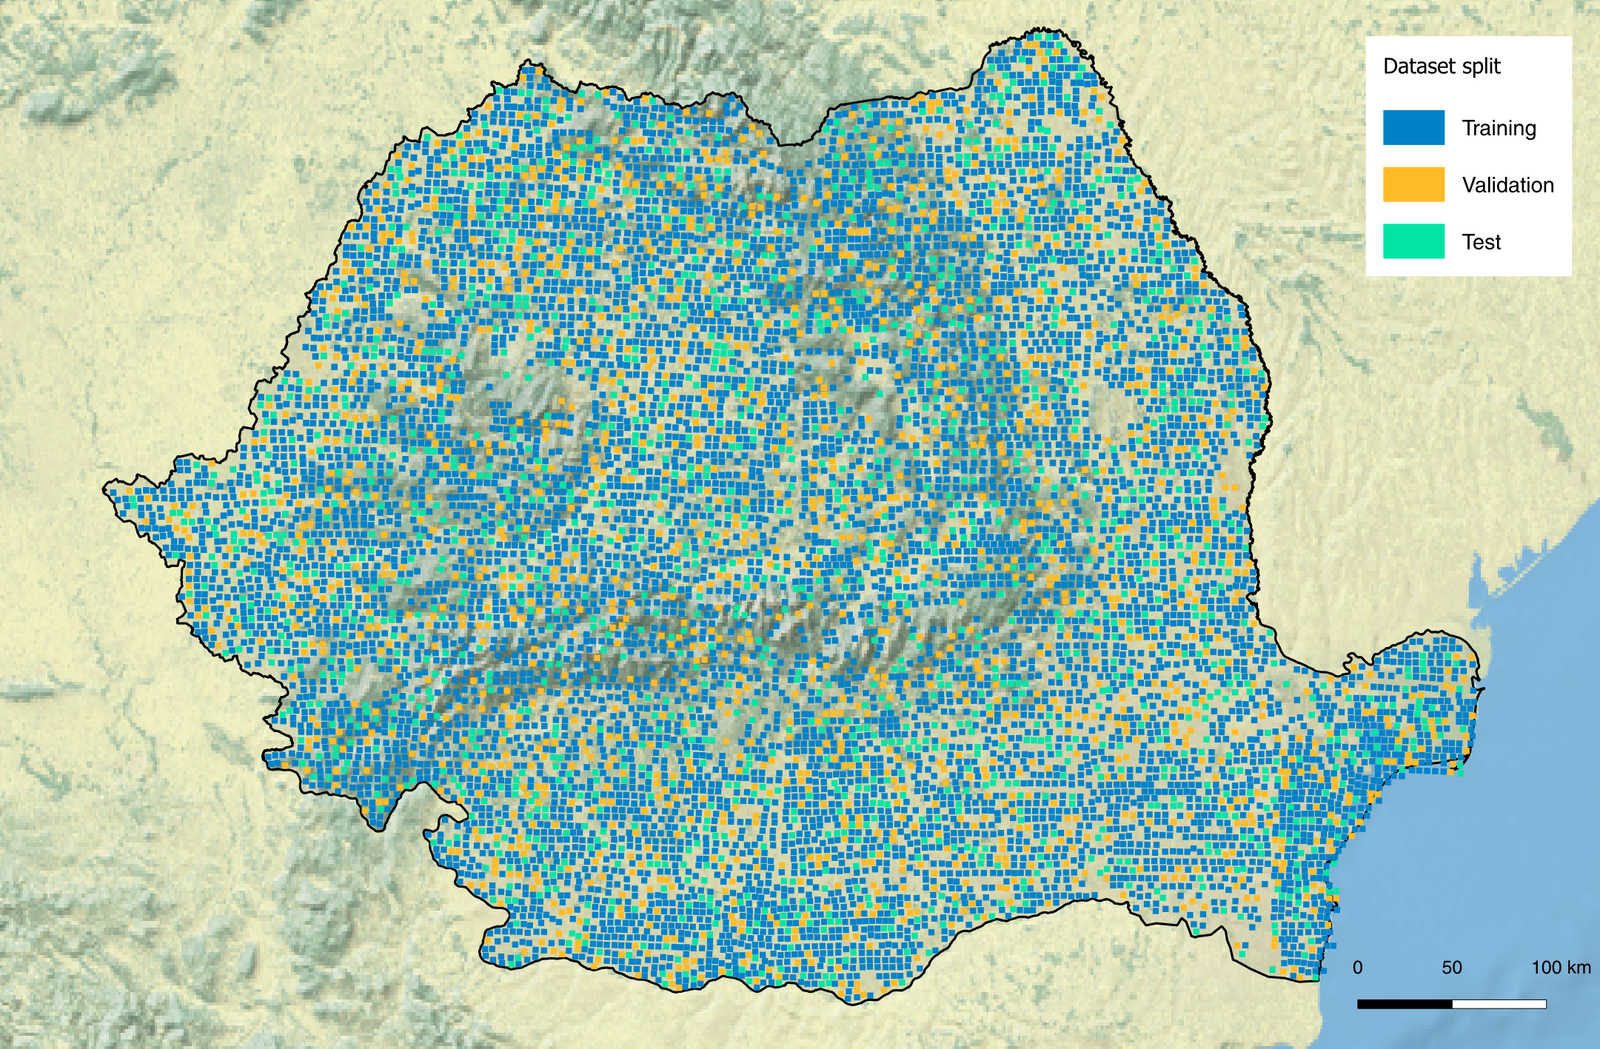
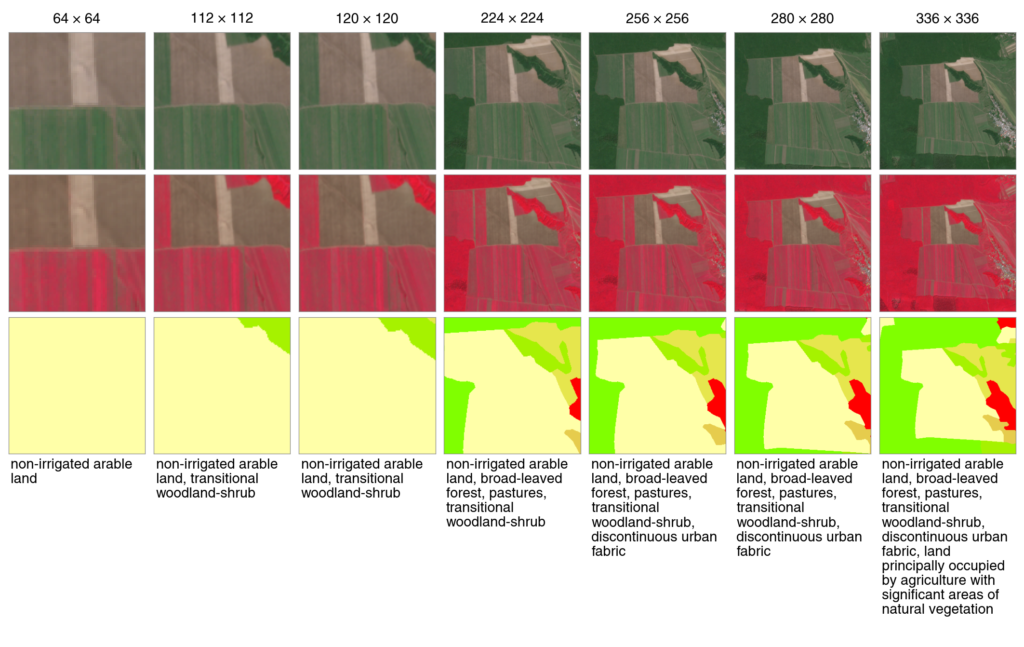
SENSERO is a dataset of exactly 10,000 locations across Romania, each imaged by Sentinel-2. What sets it apart from other remote sensing datasets is a design decision: instead of fixing one patch size, as almost every other dataset does, it provides every location at eight different sizes, from a tight 64×64-pixel close-up (about 0.4 km across) out to a wide 336×336-pixel view (about 3.4 km), all sharing the same center. The whole point of that is to tackle a question the field usually glosses over — how big should a patch actually be? So the dataset doesn’t just show you 10,000 places; it shows you each place through eight windows of increasing width. That comes to 80,000 labelled images.
And they are labeled. Every patch, at every size, carries five parallel descriptions of what’s in it: three levels of the standard European land-cover hierarchy — from a handful of broad categories down to roughly thirty-four fine ones — plus two alternative vocabularies, the one used by the widely cited BigEarthNet benchmark and a scheme we adapted to the Romanian landscape. The labels aren’t hand-written; they’re generated deterministically from an authoritative land-cover map, so every one can be traced back to its source.
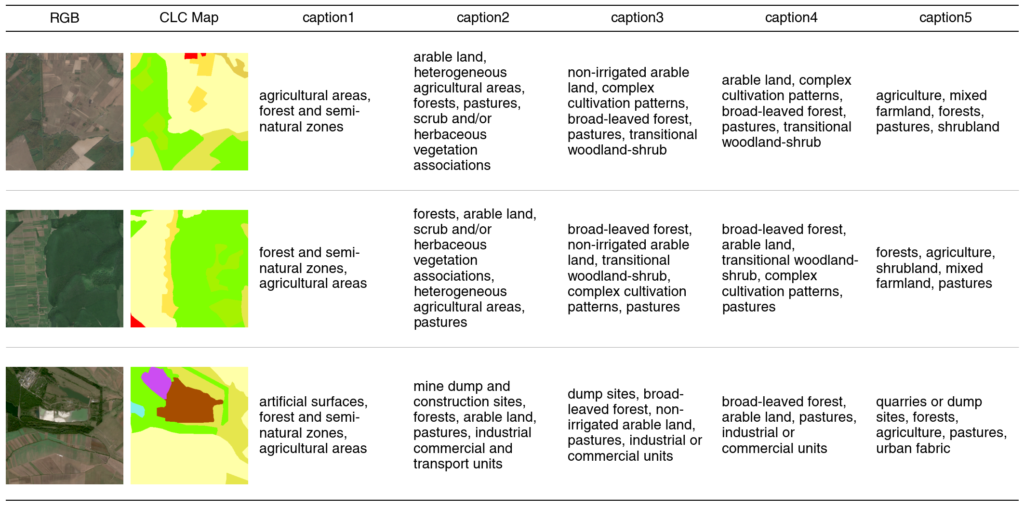
Those labels are written as simple comma-separated lists, and that’s deliberate, because it sidesteps a choice most datasets force on you. Most classic remote sensing datasets give you an image and a single class — “forest,” “water,” “urban” — which suits a traditional machine-learning classifier but flattens everything else away. The newer vision–language datasets give you free-text captions, ideal for models you can query in plain language — “show me patches with a river running through cropland” — but awkward to feed a straightforward classifier. SENSERO’s labels sit in both worlds at once: read the string as a phrase, and you have a caption for a vision–language model; split it on the commas, and you have a clean multi-label list for classical machine learning. The same dataset serves both, with no reformatting — and it does so at every one of the eight scales.
A couple more things make it more than just “images with text stapled on”:
- A deliberately chosen acquisition window. Every patch comes from a nine-week stretch in late summer 2018 (9 August to 14 October). That’s not arbitrary: it’s a narrow window with low cloud cover, no frost or snow, and a stable phenological state — so a wheat field looks like a wheat field across the whole dataset, instead of one image showing bare soil and another full canopy. Consistency here quietly removes a whole category of noise that would otherwise confuse a model.
- Geography-aware splits. The training, validation, and test sets are separated by location rather than shuffled at random. No two patches overlap at any scale, and we also enforced a minimum distance between training and test patches — because nearby pieces of land tend to look alike (an effect called spatial autocorrelation), and without that gap a model can look good simply by being tested next to places it had already seen in training. So it is genuinely measured on ground it never saw. (The exact distances, and the handful of unavoidable exceptions, are documented in full in the accompanying paper.)
Why “one patch size” is a hidden assumption
Almost every remote sensing dataset makes a silent decision and then never revisits it: it picks a single patch size. EuroSAT cuts the world into 64×64-pixel tiles, BigEarthNet into 120×120, and from then on every model trained on them sees the landscape through that one fixed window — and only that one.
But scale isn’t a technicality; in geography it’s part of the meaning. A 200-meter window might capture a single field; a one-kilometer window captures that field’s place in a mosaic of plots, roads and a river. Zoom in, and you see texture; zoom out, and you see context. A model handed only one of those is being quietly told that the other doesn’t matter.
What’s surprising is how little we actually knew about which window is right. The question — how much does patch size change what a model learns? — had been poked at only in scattered, one-off experiments that tend to disagree: some report accuracy climbing as patches grow, others find that larger patches blur away the very detail that made the classification work. The reason is structural. Patch size has almost never been studied as a variable in its own right, because in practice it’s constrained to the dataset — change the size and you’ve usually also changed the sensor, the region and the labels, so you can never quite tell which one moved the result.
This is the gap SENSERO aims to fill. The same location is provided in eight sizes that share the same center, labeling scheme, and acquisition date, so the only thing that changes from one version to the next is how much surrounding land the window includes. That turns patch size from an arbitrary number buried in a config file into something you can actually run a clean, controlled experiment on.
What it turned out to show
So we ran that experiment — and the answers are not the obvious “bigger is better.”
For coarse distinctions (is this urban, farmland, forest, or water?), the size of the window barely mattered: a small patch already does the job. But for fine-grained classes, more context helped a great deal — and in a telling way. The classes that gained most are the ones whose very definition is a pattern rather than a thing: “complex cultivation,” “transitional woodland-shrub,” a mosaic of small fields. A narrow window lands on one field and can’t tell which pattern it belongs to; a wide window shows the pattern itself. The patch size a model needs, it turns out, is set less by the sensor than by how finely you’re asking it to name the land.
The gains flatten out, though. Past roughly 224–256 pixels — around 2 to 2.5 km across — bigger windows stop buying much. And there’s an asymmetry worth knowing: a model trained on wide views adapts gracefully to narrow ones, but a model trained on narrow views stumbles when handed a wide one, because it never had to recognize many things at once.
There’s one more finding that’s easy to miss but matters a lot: how you decide to label the land — how finely you split it into categories — changes a model’s results about as much as the patch size does. Call something simply “forest” and a model handles it easily; ask it to tell broad-leaved, coniferous and mixed forest apart, and the same model on the same image suddenly looks much weaker. The catch is that two studies reporting very different accuracies might not actually disagree about anything real — they may just have sorted the same ground into different categories. So both choices, patch size and how the land is labeled, deserve to be stated up front and compared fairly, not left unsaid. SENSERO lets you test them one at a time.
Who is this for?
If you’re a student stepping into Earth observation, SENSERO is meant to be approachable: a ready-made, labeled dataset with clean train/test splits that you can use to learn how land-cover models — classical or vision–language — behave on real geospatial data, without first spending three months wrangling raw tiles.
If you’re a researcher, it’s a benchmark whose methodology you can scrutinize, with reproducible baselines — and at the same time a national-scale dataset for a country that’s absent from the main European collections like BigEarthNet, which makes it a ready-made target for testing how models trained elsewhere hold up over new ground.
And if you’re simply curious about how satellite photos become something a computer can learn from, I hope this gives you a peek behind the scenes. The images themselves are free for anyone to download, but turning them into a dataset people can rely on takes a lot of patient, mostly invisible work — and that work is what SENSERO is really about.
Behind SENSERO
SENSERO is a team effort from the GeoSense lab at POLITEHNICA Bucharest. I spent much of my time building the dataset; my colleagues were essential in validating the data and results, analyzing them, and shaping the final manuscript. The project grew out of a fairly simple frustration: there was a lot of beautiful imagery over Romania and very little of it in a form you could just use. Building the thing properly — the dense multi-scale sampling, the five label layers, the spatially honest splits, the endless consistency checks — took far longer than the version that would have looked fine in a slide. I think it was worth it.
The dataset, the processing pipeline, and the benchmark code are all openly released under a Creative Commons license — the data on Zenodo, the code on GitHub — and the full paper is published in Remote Sensing (MDPI).
If you end up using it, for a thesis, a paper, or just a weekend experiment, I’d love to hear what you build. And if you publish academic work based on SENSERO, let us know: we’d be glad to list your paper among the related works on the dataset’s Zenodo page, so others can find it too.