Teodor Costăchioiu
  • Home
  • Notes
  • About
    • Career
    • Publications
  • Contact
  • English
    • Română
Author

Teodor Costăchioiu

Teodor Costăchioiu

School in Serbia
Data Explorations

Schools in Bucharest and Ilfov (2026) – analysis and trends

by Teodor Costăchioiu July 31, 2026
written by Teodor Costăchioiu

In the short term, the number of students fell. In the long term, Bucharest and Ilfov gained share of the national total. Grades fell everywhere in 2026, but the drop comes primarily from a harder exam, not from the schools. The number of candidates also fell, even though 2025 had been a peak. In the long term, Bucharest and Ilfov gained share of the national total. What changes the least are the gaps—between areas and between schools—and the loss of student numbers isn’t uniform: it is concentrated in mid-tier schools.

It’s been a while since the National Evaluation results were published, but I finally managed to make a bit of time to download the data from evaluare.edu.ro, process it, and update the school maps. I’ve already reached the fifth edition of this analysis (see previous editions here).

As every year, I updated both the map of public schools and the map of private schools. The detailed analysis, at the level of each education unit, remains based mainly on results from 2023–2026.

This year, however, I also added more historical context. On the data.gov.ro portal I found older datasets that I didn’t have in my collection. So, for regional-level comparisons, I was able to extend the analysis over time and included results from 2018–2022.

If in the first years this series was mostly about observing and understanding the education landscape in Bucharest and Ilfov, this year the stakes become personal: our child is starting preparatory class.

We still live in Chiajna. We haven’t found a home in Bucharest that we like, that’s located in a suitable area and, at the same time, fits our budget. Moving closer to the city center—which we had considered in previous years—didn’t happen.

We chose a nearby private school. Not because money is no object, but because the public school we’re assigned to is a disaster: the three schools in Chiajna have school-level averages of 6.15, 6.55, and 6.63, all down from last year, and we’re assigned to the weakest of them. So we put our child’s well-being first, even if that requires sacrifices.

After a few years of looking at schools as points on a map, we can say that starting this year we’ve become direct beneficiaries of these analyses.

Methodology

I used the individual results files for 2018–2025 from data.gov.ro and the data extracted from the evaluare.edu.ro pages for 2026. I complemented these sources with the school-aggregated tables and the maps produced for previous editions.

In what follows, by “candidate present” I mean a student for whom there is a valid final average in the National Evaluation. When I compare the performance of regular education units, the main analysis does not include special schools, nor arts- or music-profile units.

For the comparison between schools in 2018 and those in 2022, I used the SIIIR code, which makes it possible to identify the same education unit even if its name changed in the meantime. I included only schools that had at least 20 candidates in both years, to reduce the influence of very small cohorts on the results.

For the recent series, matching schools across years was verified separately. Some units changed their name, legal form, or the way they appear in the official files, so an automatic match based solely on the name could have produced errors.

The 2019 data were used for the final average, the average for grades 5–8, background (urban/rural), and candidates’ sex. I did not use the subject-level statistics because, in the available file, some grades were converted into calendar dates during a previous conversion. I preferred to exclude these values rather than introduce reconstructed results with too high a degree of uncertainty into the analysis.

Year-to-year comparisons are descriptive. The topics, organizational rules, and the context in which the exams took place are not identical. In particular, results from 2020–2022 must be interpreted in light of the COVID-19 pandemic, the suspension of in-person classes, periods of online schooling, and changes to the curriculum and exam organization. In 2026, the difficulty of the tests appears to have increased noticeably nationwide, which means a school can drop into a lower color category even if nothing changed inside the school.

School-level averages have uncertainty that depends strongly on the number of candidates. For a unit with 200 students, the annual average is stable; for one with 7, a single grade can shift the average by more than half a point. I always report the number of candidates alongside the average and avoid calling a very small-cohort school “first” or “last.”

How to read the maps

The map-making methodology has remained unchanged from previous editions. I kept the same symbols and the same color palette, so results can be compared more easily from one year to the next.

The markers indicate the type of education unit:

  • simple marker for primary and lower-secondary schools;
  • round marker, with a square in the center, for colleges that include both lower-secondary and upper-secondary classes;
  • round marker, with a dot in the center, for religious education units and for bilingual ones.

The colors indicate the average obtained by the school’s candidates in the National Evaluation:

  • blue — primary schools or units with no candidates in the National Evaluation;
  • green — average of at least 9.01;
  • yellow — average between 8.01 and 9.00;
  • orange — average between 7.01 and 8.00;
  • red — average between 6.01 and 7.00;
  • dark red — average of at most 6.00, the category I’ve called, since the very first editions, “God forbid.”

The main novelty of this year’s edition is the analysis of how the number of candidates varies from one cohort to the next. I now have enough data to make this comparison and, in many respects, the evolution of student numbers is even more interesting than the evolution of grades.

So I’m not only comparing the averages obtained, but also the number of students who ended up sitting the National Evaluation in each education unit. This perspective brings to light changes that weren’t visible in previous editions: schools whose cohorts are growing, units that are losing students, and categories of schools where the decline in student numbers is more pronounced.

What the public-school landscape looks like in 2026

You are currently viewing a placeholder content from Google Maps. To access the actual content, click the button below. Please note that doing so will share data with third-party providers.

More Information
Unblock content Accept required service and unblock content

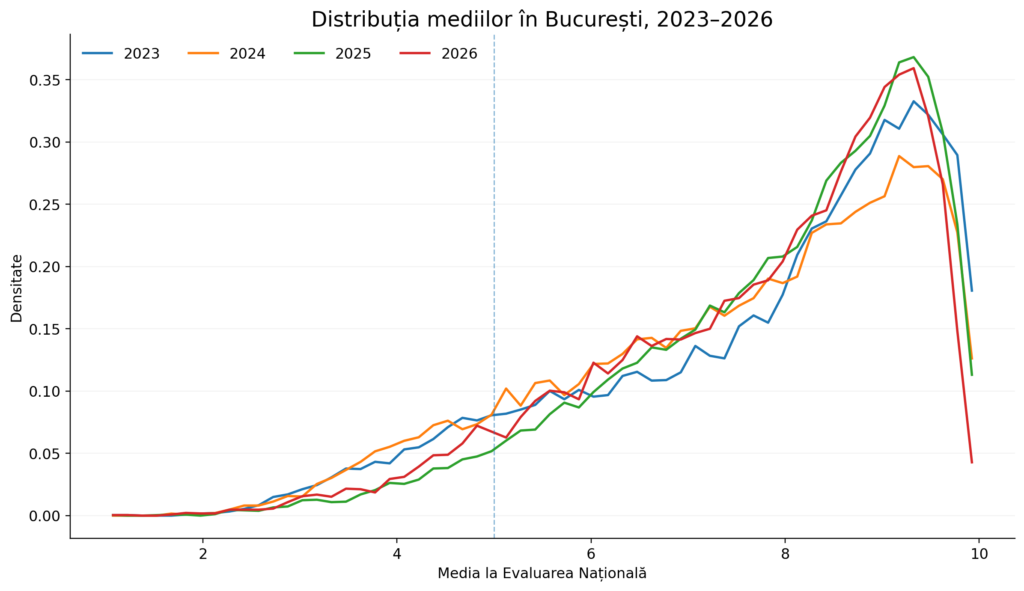
The map has gotten darker. Not dramatically, but enough for the change to be visible—2026 was a tough year nationwide. The share of candidates with averages above 5 fell from 83.1% to 79%, and the number of perfect 10 averages collapsed from 85 to 7—the lowest level since 2013. The distribution shifted downward across the country, and part of what we see on Bucharest’s map is a consequence of that shift, not of what happened in schools.

The number of schools in the yellow category, with averages between 8 and 9, fell from 56 to 40. At the same time, the red category, corresponding to averages between 6 and 7, grew from 67 to 75 schools, and the dark red category, with averages below 6, from 44 to 49. The orange zone remained almost unchanged, with 90 units.

The overall picture suggests that a significant group of schools that in 2025 were in the good-results category dropped one step in 2026. The change is not a general collapse, but it indicates a visible shift of the distribution toward weaker-result categories.

The temptation is to read this as a deterioration of Bucharest schools. I think that would be wrong. The color thresholds are fixed, and the distribution moved down by about 0.17 points; a shift of that size mechanically pushes out of the yellow band all schools that were less than 0.17 points above the threshold of 8, regardless of what happened in the classroom. Losing 16 out of 56 yellow schools is compatible with a simple shift of the entire distribution. The map tells us that in 2026 fewer schools crossed thresholds defined four years ago—not that fewer schools are good.

The weighted average by number of students, calculated for public schools in Bucharest and Ilfov, fell from 7.61 to 7.44. Looking at each unit individually, 68% of schools obtained a lower average than in 2025, and the median drop was 0.19 points.

At the bottom of the ranking, the situation also worsened: the number of public schools with an average below 5 rose from 15 to 22.
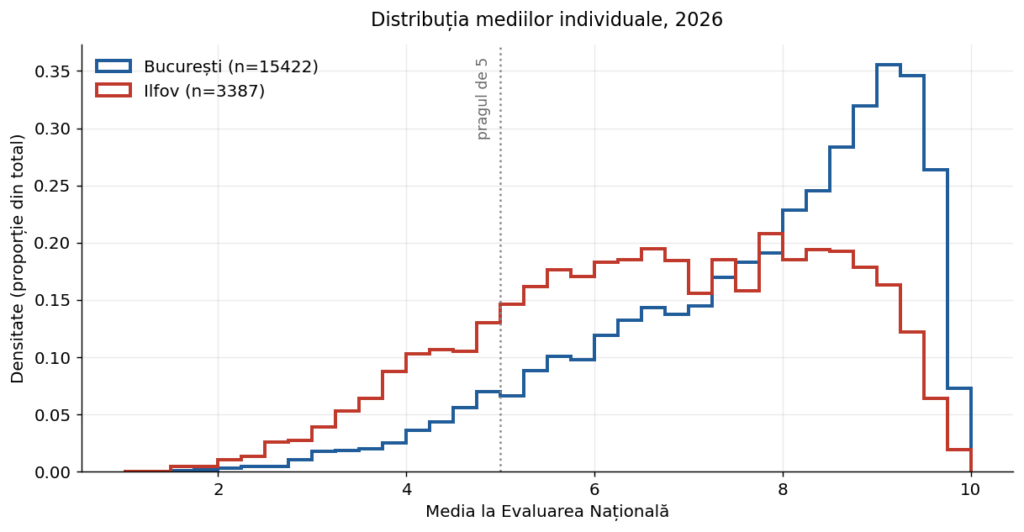
The distribution of averages is not surprising. Nationwide, the share of candidates with averages above 5 fell from 83.1% to 79%, and the number of perfect 10 averages collapsed from 85 to just 7—the lowest level recorded from 2013 to the present.

Three of the seven students with a perfect 10 average in the entire country come from Bucharest: from “I. G. Duca” Lower Secondary School, “Leonardo da Vinci” Lower Secondary School, and Lower Secondary School No. 142. It’s worth noting, however, that School No. 142 has an overall cohort average of 7.58. A single student with a perfect 10 says very little about a school’s overall performance.

At the top of the ranking, the situation remains predictable. All seven public schools with averages above 9 are national colleges, and four of them had fewer than 30 graduates. “Gheorghe Lazăr” National College leads the ranking, with an average of 9.50 and 29 candidates.

Such results must be viewed in context, however. It is much easier to obtain a very high average when only a single, carefully selected class reaches the exam—made up of students who typically benefit from strong family and educational support. I’m not saying the result isn’t valuable, only that it can’t be compared directly with the performance of a school that sends two hundred or three hundred children to the exam.

The truly interesting performance, in my view, shows up elsewhere. Lower Secondary School No. 79 in Sector 4 obtained an average of 8.94 with 196 graduates. Lower Secondary School No. 195 in Sector 3, the largest unit in Bucharest, had an average of 8.44 with 294 students and, unlike most schools, increased its cohort, from 255 graduates the previous year. Lower Secondary School No. 56 in Sector 2 obtained an average of 8.49 with 221 candidates.
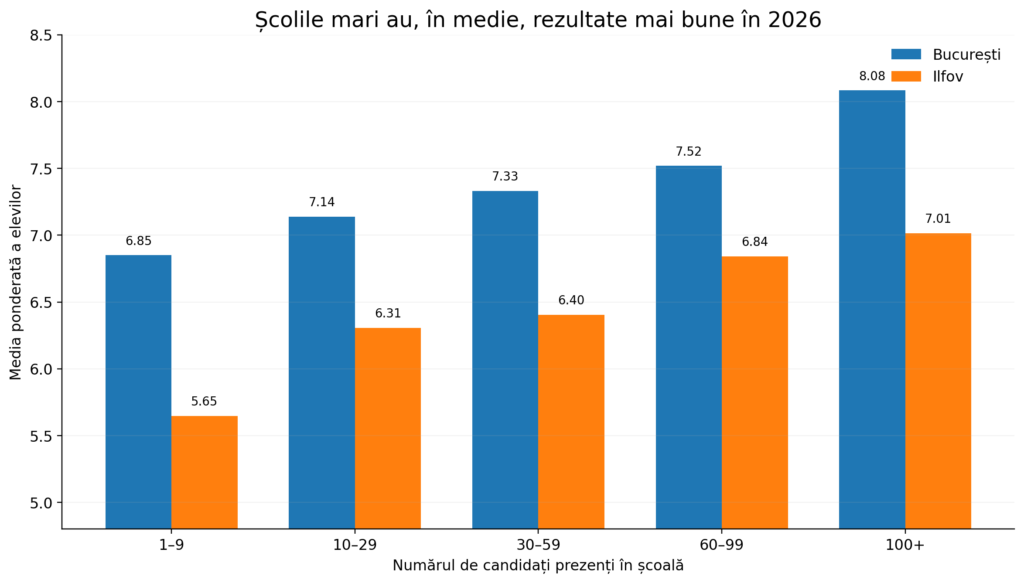
These are the figures I consider most relevant: good results achieved with large cohorts, not just spectacular averages calculated on a few dozen students.

At the other end of the ranking, the situation remains serious. The weakest results were recorded at Lower Secondary School No. 2 Tânganu–Cernica, with an average of 3.59 and 17 candidates; at Lower Secondary School No. 3 Bobești–Glina, with an average of 4.05 and 7 candidates; and at Lower Secondary School No. 1 Ștefăneștii de Jos, with an average of 4.06 and 48 candidates.

In Bucharest, the lowest average appears at Lower Secondary School No. 22 in Sector 3—4.08—calculated, however, for seven graduates. I don’t list it as “the worst school in Bucharest”: with seven students, next year’s average could be a full point higher without any real change.

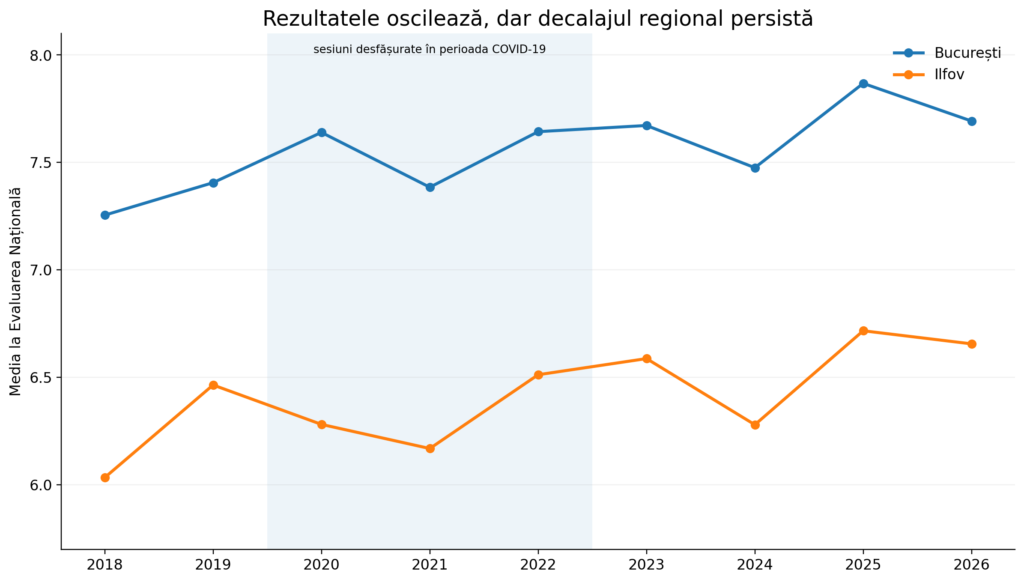
Ilfov remains well below Bucharest’s level. Even in better years, Ilfov has about twice, or more than two and a half times, as many candidates below the average-5 threshold. This is a more important difference than a few tenths in the county average, because it describes a large population of students who reach the end of lower secondary with serious difficulties in the exam subjects.

No school in the county exceeded an average of 8, just like the previous year. The top-ranked is again Lower Secondary School No. 1 Buftea, with an average of 7.74, down from 7.90 in 2025. The number of candidates also fell, from 141 to 114.

The small size of some cohorts complicates interpretation even further. Seven schools in Ilfov had fewer than ten students present at the exam. In such cases, a school’s average can change sharply from one year to the next depending on the results of a few children, and it says little about the unit’s real stability.
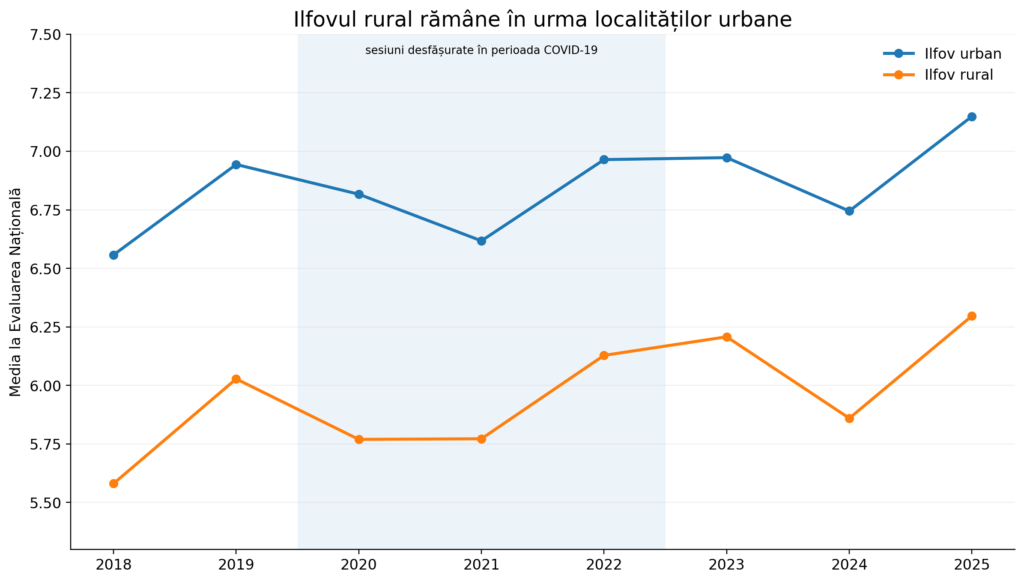
In Ilfov, a strong internal polarization is also visible, reflected in the large differences between results in schools from urban localities and those in rural areas. The county average actually hides two distinct educational realities: urban localities with relatively good results, and rural communities where averages are considerably lower and the share of candidates scoring below 5 is much higher.
A major gap continues to persist between report-card averages and the results obtained in the National Evaluation. This gap suggests that, in many schools, students are graded generously over the years of study, and classroom grades do not always reflect the level demonstrated in a standardized exam.

The distribution of results changes relatively little from one year to the next, suggesting a stable educational landscape. Unfortunately, what’s stable isn’t only the overall results, but also the gaps between Bucharest and Ilfov, between urban and rural, and between schools at the extremes of the ranking.
Private schools in 2026

The private-school map contains 88 units, of which 43 had graduates in the National Evaluation—three more than last year. The rest are primary schools, kindergartens with a primary cycle, or units that haven’t yet taken a cohort all the way through.

You are currently viewing a placeholder content from Google Maps. To access the actual content, click the button below. Please note that doing so will share data with third-party providers.

More Information
Unblock content Accept required service and unblock content

The weighted average fell here as well, from 8.84 to 8.65, so the general downward trend in grades affected these too. But the picture remains clearly better than in the public system: 13 private schools have averages above 9 and 20 have averages between 8 and 9.

The observation I make every year remains valid: cohorts are very small. Seven private schools had at most five graduates. There is one with two students and three with three students each. An average of 9, calculated on three students, is not statistically meaningful.

The exceptions that matter are few. The International Theoretical High School of Informatics Bucharest remains the largest, with 214 graduates and an average of 8.51—but it too is down from 243 students and 8.79 last year. The “European School Bucharest” Theoretical High School recorded a spectacular increase, from 48 to 73 graduates, with an average of 9.28. The “Romanian-Finnish” High School held steady at 67 students and 8.48.

One good thing to note: the absence rate in private schools fell from 7.95% to 3.63%. In previous years I flagged private schools with dozens of absentees and a handful of students present, a sign that students were following an international curriculum and weren’t interested in the National Evaluation. The phenomenon has eased—but not everywhere.

How the number of students has evolved

The first thing that stands out in the 2026 data is the reduction in the number of candidates compared to 2025. Bucharest went from 17,307 candidates present in 2025 to 15,422 in 2026, which means a 10.9% drop in a single year. In Ilfov, student numbers fell from 3,517 to 3,387 candidates, i.e., by 3.7%. Nationwide, the drop was 5.9%, from 152,233 to 143,251 candidates.
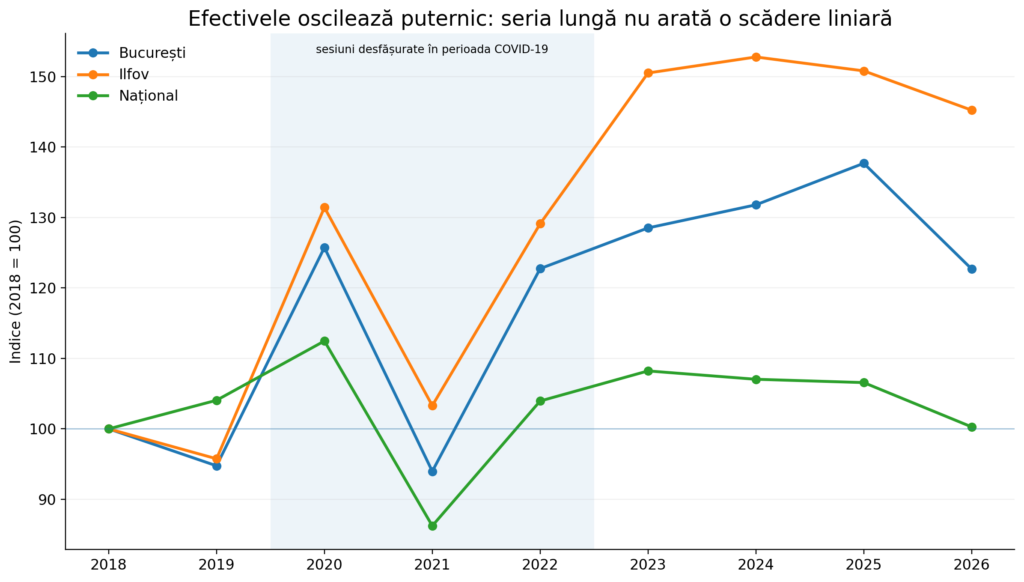
Viewed in isolation, these two editions suggest a rapid retreat of the school population from the Capital. Bucharest seems to be losing students almost twice as fast as the country as a whole, and the total number of candidates in Bucharest and Ilfov falls by 9.7%. But 2025 was not a typical year: it was the maximum of the entire series for Bucharest, with 17,307 candidates.

From this perspective, 2026 looks more like a return from a peak than an unprecedented collapse. Bucharest ends up almost exactly at the 2022 level: 15,422 candidates in 2026, versus 15,428 in 2022. In Ilfov, the 2026 cohort remains 12.5% above the 2022 level. The conclusion therefore depends very much on the comparison’s starting point.

In the long run, things look a bit different. Between 2018 and 2026, the number of candidates in Bucharest increased by 22.7%, and in Ilfov by 45.2%. Over the same interval, the national total remained practically unchanged: 143,251 candidates in 2026 versus 142,847 in 2018, a difference of just 0.3%. Together, Bucharest and Ilfov have 26.2% more candidates than at the start of the series.

This evolution is also visible in the share of the Bucharest–Ilfov area in the national total. In 2018, the two regions represented 10.4% of the country’s candidates. In 2025 they reached 13.7%, and after the 2026 drop they remained at 13.1%. In other words, even after last year’s setback, Bucharest and Ilfov concentrate a significantly larger share of candidates than eight years ago.

This does not mean that all localities around Bucharest are growing at the same pace, nor that every school benefits from this concentration. Regional data can hide important shifts between localities, between public and private schools, or between units with different reputations. They do show, however, that the 2026 drop cannot be presented as a linear depopulation of the Bucharest–Ilfov system, but it is an alarm signal and we will need to watch what happens in the years to come.

The pandemic years break the series

The largest swings appear in 2020–2022. In 2020, student numbers rise sharply: by 32.7% in Bucharest and by 37.3% in Ilfov compared to 2019. In 2021, a drop follows: 25.3% in Bucharest, 21.4% in Ilfov, and 23.3% nationwide. In 2022, the number of candidates returns almost to the 2020 level.
These movements should not be read as pure demographic variation. The 2020–2022 sessions took place in the context of the COVID-19 pandemic, with interruptions to in-person classes, online schooling, adapted curricula and rules, as well as unusual participation conditions. The number of candidates present at the exam depends on cohort size, but also on schooling pathways, participation, dropout, enrollment, and the specifics of each session.

That is why the National Evaluation series is not a complete census of children of the same age and cannot, on its own, support a demographic forecast. It is, however, very useful for showing how many students actually reach the end of lower secondary and sit the exam in each region.

The recent period: fewer candidates, but a smaller contraction than nationwide

If we choose 2023 as the reference point—the first year in the recent series used in detail in this analysis—Bucharest loses 4.5% of candidates by 2026, and Ilfov 3.5%. Over the same period, the national total falls by 7.3%. The Bucharest–Ilfov area is contracting, but more slowly than the country as a whole, and its national share continues to edge up, from 12.7% to 13.1%.
This perspective is less spectacular than the 2025–2026 comparison alone, but it is also more robust. 2025 was a local peak, and 2026 a pullback. Over three years, Bucharest and Ilfov do not appear as regions emptying out faster than the rest of the country.

The decline is not evenly distributed across schools

The regional series tells us how large the cohort is in Bucharest or Ilfov, but it doesn’t show where the change occurs. For the recent period, I was able to track the same 217 Bucharest schools and compare cohort sizes in 2024 with those in 2026. The units were grouped by the average obtained in 2024, so we can see whether the decline is general or concentrated in a particular part of the ranking.
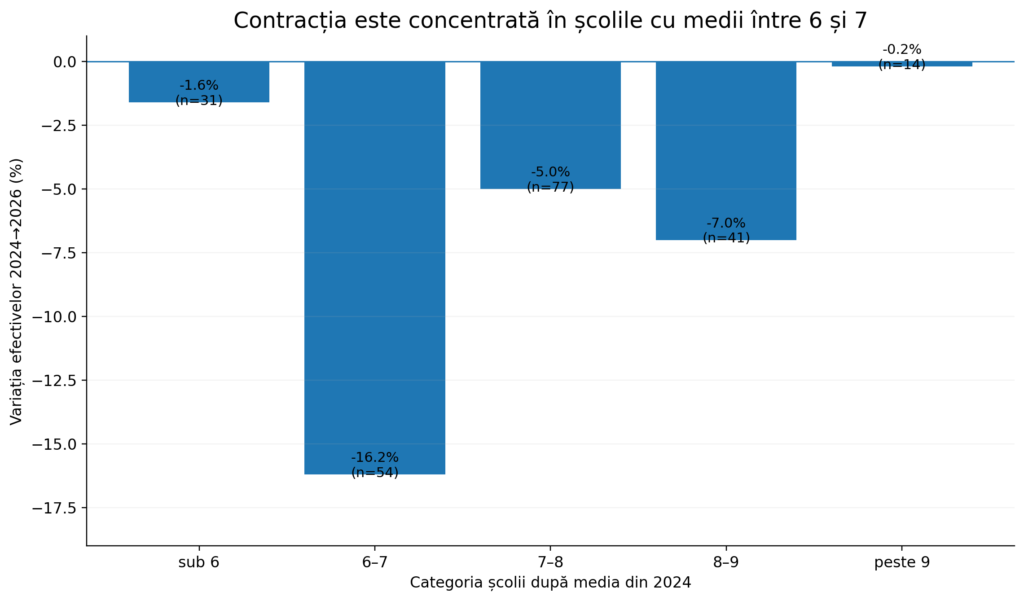
The result is surprising. Schools with averages between 6 and 7 lost 16.2% of candidates. In the 7–8 and 8–9 categories, the decline was about 5% and 7%, respectively. At the extremes, the change was much smaller: minus 1.6% for schools with averages below 6 and close to zero for those with averages above 9.

The recent contraction therefore does not seem to hit all units equally. It is concentrated mainly in the lower-middle results zone. These schools are not always bad enough to trigger an immediate reaction, but neither are they good enough to retain, without difficulty, families who have alternatives. It is possible that some parents are seeking better-rated public schools, private education (although no spectacular increase in the number of private-school students is visible), or units in other localities. The available data do not allow tracking each student’s path, however, so this explanation remains a hypothesis.

Just as important is that the cohorts of very good schools remain almost stable. Units with averages above 9 lost, overall, only 0.2% of candidates between 2024 and 2026. Demand for these schools seems to hold up even when the regional cohort shrinks.

What we can and cannot say from these data

The data show the school and the region where a student sat the National Evaluation. They do not show where the student started 5th grade, whether they transferred in the meantime, whether they moved from public to private, whether the family moved, or whether the student left the system before the exam. For this reason, changes in cohort sizes cannot automatically be interpreted as birth rates, migration, or dropout.

We can still formulate three solid conclusions. First: the 2026 decline is real and important, especially in Bucharest, but it starts from a peak and brings the Capital back close to the 2022 level. Second: in the long run, Bucharest and especially Ilfov have gained candidates and increased their share of the national total. Third: in the recent period, the loss of student numbers is selective and concentrated in lower-middle-performing schools.
July 31, 2026 0 comments
0 FacebookTwitterPinterestEmail
Announcements

Why I Shut Down a Few Websites — And What Comes Next

by Teodor Costăchioiu April 3, 2026
written by Teodor Costăchioiu

If you landed here looking for an older article of mine, you might not find it anymore. That’s not a bug — it’s a decision I’ve been thinking about for a long time.

After nearly three decades working in IT and remote sensing, I had accumulated a rather fragmented online presence: personal blogs, technical articles scattered across multiple platforms, experimental tutorials, posts that made sense when I wrote them but no longer reflect where I’m headed professionally.

I’ve decided it’s time for a thorough cleaning, and this year I have some time to get it done.

What changes

I’m rethinking my online presence from the ground up. In practical terms, this means a few things:

I’ve consolidated everything that matters into a single place — this website. Secondary blogs have been shut down or are being shut down. Older articles — the ones that no longer brought meaningful traffic and no longer represented my current level of expertise — have been retired. Not out of nostalgia or haste, but because a library of outdated content does more harm than good, both for the reader and for me.

In addition, the blog will become bilingual, with a primary focus on English, to reach a wider audience, particularly in the professional sphere. The old Romanian-language personal blog has been redirected to the Romanian-language section here.

Why now?

The reason is simple: I want my personal website to accurately reflect what I do. In December 2024, I returned to academic research at the newly established GeoSense laboratory after running my own limited liability company for over ten years. This transition has refocused my professional attention on what I am most passionate about: satellite image analysis, artificial intelligence for Earth observation, and the development of remote sensing software. These are the fields in which I have experience, ongoing projects, and relevant insights to share.

In addition, many of my personal interests intersect with my professional work — particularly exploratory data analysis, electronics, and small-scale automation projects — and these will also be reflected on the blog.

Going forward, all content published here will be closely aligned with my research and professional activity, focusing on practical tutorials, case studies, tools, and insights derived from projects I am directly involved in.

There’s also a practical side to this. Maintaining multiple blogs in parallel was eating into the time I’d rather spend on my work, research, code, and new articles. On top of that, there were the costs: theme licenses, hosting plan, and paid plugins. Consolidating lets me drop some of those expenses and redirect resources where they matter.

Nothing of value is lost

If an older article was useful to you and you can no longer find it, I apologize for the inconvenience. Genuinely valuable content has either been updated and folded into this site or will be rewritten in better form. The rest served its purpose at the time.

The old articles haven’t vanished entirely — I will keep them in an archive. If you’re interested in a specific piece, get in touch, and I can either put it back online or send it to you directly.

If you have questions or you are looking for something specific, don’t hesitate to reach out.

Photo by Zetong Li on Unsplash

April 3, 2026 0 comments
0 FacebookTwitterPinterestEmail
Școală în Serbia
Data Explorations

Schools in Bucharest and Ilfov – a view from high above (2025)

by Teodor Costăchioiu July 8, 2025
written by Teodor Costăchioiu

Another year has passed, and another generation has gone through the National Assessment, and the results have been published on evaluare.edu.ro.

I managed to find the time to download the data, update the maps with the fresh information, and, as usual, I am publishing them together with a short analysis, as I have done in previous years.

At first glance, there are no major changes. Pretty much everything I wrote in the first edition of the 2021 analysis of schools in Bucharest and Ilfov remains valid today. There were no significant changes compared to last year’s edition either.

And on a personal level, we still live in Chiajna, and we face the same problem when it comes to choosing a school for our child. We still have a year before a decision has to be taken…

Going back to the maps, the methodology used has remained the same – the markings, colors and philosophy behind them are the same. The data source is, as last year, evaluation.edu.ro. For maps we used:

  • simple marker for primary and secondary schools;
  • a round marker with a square in the middle for colleges (grades 5-8 plus high school);
  • a round marker with a dot in the middle for religious and bilingual schools.

As in previous years, we have not included arts and crafts or special schools on the map.

As for the marker colors, we kept the color palette from previous years:

  • blue – primary schools
  • green – average over 9.01
  • yellow – averages between 8.01 and 9
  • orange – averages between 7.01 and 8
  • red – averages between 6.01 and 7
  • dark red – average under 6, category “God forbid”

This year we made two changes: one cosmetic – harmonizing the names of schools with those in the official tables; and one more significant – including the number of students who graduated the National Assessment exam as well as those who were absent. I will do the same in the years to come.

This change gives a clearer picture of the impact of the demographic decline, which is starting to be felt also in the evaluation results. Unfortunately, there is a worrying trend: fewer pupils, declining results and a concentration of problems in peripheral and rural areas.

You are currently viewing a placeholder content from Google Maps. To access the actual content, click the button below. Please note that doing so will share data with third-party providers.

More Information
Unblock content Accept required service and unblock content

Overall, the results seem to have returned to some normality. After the period of large variations during the pandemic and the years immediately following, this year there were no noticeable differences from 2024. The most significant changes are in the area of schools that underperformed last year, some of which managed to move up a category, maybe even two.

As far as state schools are concerned, the situation is relatively constant: most grades between 9 and 10 come from national colleges, but many of them have very small numbers of graduates – some with 21, 28 or 29 students. When you have one class of “Olympians”, good results are predictable. But there are also big schools with excellent results – one example is Secondary School 79, with 211 graduates and an overall average of 9.01. This is a remarkable performance.

Between these extremes we find the “normal schools”, with 60-80 pupils, where hard work is visible.

The geographical distribution of performance unfortunately remains uneven. Poorly rated schools are mainly on the outskirts of the city – with small exceptions such as the Dudești-Timpuri Noi area. These low-performing schools also generally have very few students: we find schools with only 15, 17 or 22 graduates in Bucharest. In Ilfov we found nine schools with less than 10 graduates each.

In densely populated areas such as Drumul Taberei, Militari, Berceni, Ștefan cel Mare or Dorobanți, the numbers are more balanced – around 70-90 pupils per school, and the results are generally better.

Ilfov, on the other hand, remains an area with serious educational problems. Although there are some schools that have made visible progress, moving from ‘disastrous’ to ‘acceptable’, the number is small. In many localities around Bucharest we find strange situations: schools very close to each other – sometimes 2-3 km from each other – operate as separate entities, each with 15-20 students. It is hard to understand why they are not merged, especially in the context of limited resources.

No school in Ilfov managed to get an overall average above 8. The best result belongs to Buftea Secondary School No. 1, with a school average of 7.90 and 141 graduates.

Private schools in 2025

In private schools, there are some new developments compared to previous years. More and more of them are completing the secondary cycle with a full set of graduates, allowing them to appear for the first time in the rankings with colored markers. Surprisingly, many of these private schools have excellent results – averages between 9 and 10 or between 8 and 9 – but with one important caveat: almost all of them have very small classes of 2, 4, 6 or 30 pupils at most. That often means one class.

I found, for example, a private school with only one graduate with a 7.95 average. It’s hard to imagine what the educational process looks like in a school where you’re the only student in the class…

A notable exception is the International Theoretical High School of Computer Science in Bucharest, with 243 graduates and a high school average of 8.79 – a figure comparable to that of large public schools.

You are currently viewing a placeholder content from Google Maps. To access the actual content, click the button below. Please note that doing so will share data with third-party providers.

More Information
Unblock content Accept required service and unblock content

All in all, there are no dramatic changes in the educational landscape compared to last year, but some trends are becoming more pronounced: the depopulation of schools in the suburbs, despite real estate developments in these areas. The race for good schools continues, with the differences between the center and the periphery becoming more pronounced. Ilfov County is stagnating. The presence of private schools in the overall landscape is growing. It remains to be seen how these issues evolve in the coming years.

A bit of statistics

Since I still have the results files from last year’s Bucharest session, I did a quick comparison between the two sessions of the National Assessment.

In 2024, 16,566 students sat the exam, and 194 were absent. In 2025, the number of students in attendance increased to 17,307, with 220 absent. That’s an increase of 4.47% on the previous year.

As usual, the mother tongue exam was taken by a small number of students. In 2024, 🇩🇪 152 pupils took part in German, 🇮🇹 56 in Italian, and 🇭🇺 14 in Hungarian. In 2025, the figures were slightly different: 🇩🇪 180 pupils for German, 🇮🇹 68 for Italian and 🇭🇺 only 6 for Hungarian.

At the top of the rankings in 2024, there were 4,102 averages between 9 and 10, of which 32 were 10. In 2025, the number of averages between 9 and 10 rose to 4,976, but only 29 of these were 10s.

This rise in high averages is not necessarily a cause for celebration. While these scores may tickle parents’ egos, in practice, they make it more difficult for the allocation algorithm to distinguish among candidates. In the case of top high schools, this crowding at the top leads to fierce competition, where even a high grade may no longer be enough for a desirable place – leaving very good students on the sidelines.

This is best seen by comparing the 2024 and 2025 grade distributions. To illustrate the differences, I have chosen to use a step histogram in my graphs, which better highlights the overlaps between years and allows a clearer visual comparison. The first histogram I show is the histogram of the entire set of grades – all the averages obtained by students in Bucharest each year.

Distribution of averages in Bucharest, 2024 - 2025 (Step Histogram)

I find it interesting to look at the 8-10 grade range separately, because that’s actually where the most intense competition for a good high school enrollment is. So I’ve generated a second histogram, zooming in on just this segment – just to get a better understanding of what the competition for places at the most sought-after high schools looks like.

Distribution of averages between 8 and 10

Looking at this histogram, we observe a high density of means in the range 8.35-9.75, with a clear peak between 9.05 and 9.65. Compared to the previous year, the distribution of high grades has shifted slightly upwards, which significantly complicates the sorting process in this crowded area. In contrast, averages above 9.75 are slightly fewer than last year, and the number of averages of 10 has fallen slightly. The competition will be extremely tight in the 9.1-9.75 range, where the high concentration of candidates with similar results means that small differences will be decisive in the admission process to top high schools.

Overall, the 2025 results seem to indicate improved performance, but this is most likely due to more accessible subjects than in previous years. This relative ease has led to a concentration of students in the upper end of the grades, especially between 9.1 and 9.75, where the pressure of admission becomes suffocating. Rather than helping to make a clear-cut cut, candidates are squeezed into a very tight range, where differences of a few hundredths can make the difference between a place at a top-performing high school and one at a lower-performing one.

With all these statistics in mind, you will have to consider the reality of this ‘squeeze’ in the top grades. Even with very good averages, the line can become unpredictable. I don’t think it would be a bad idea to include a more modest high school on your list of options, but choose one you prefer, not one imposed by the system. It’s better to end up in a decent, desirable, and controlled place than to be randomly assigned

Last but not least, it is important to remember that in the current context, the position in the ranking counts more than the grade itself. A high school where last year’s last admission average was 9.50 might this year have a last average of 9.60 or even 9.70, precisely because of the general increase in grades. That’s why it’s essential to look not just at your average but also at your current ranking. Compare this position with the distribution of last year’s grades – which you can also find on the website evaluation.edu.ro – and see how the grade would correspond to last year’s context. Then take a look at what high schools were entered with that GPA the previous year.

We have to accept that, in the end, the final decision belongs to an algorithm. It’s not just about averages and preferences, it’s a numbers game – a mechanism that needs to be well understood and, as far as possible, used to your advantage. The more you get into his logic, the more likely you are to get closer to what you want. Good luck!

July 8, 2025 0 comments
0 FacebookTwitterPinterestEmail
Școală în Serbia
Data Explorations

Schools in Bucharest and Ilfov – a view from high above (2024)

by Teodor Costăchioiu August 1, 2024
written by Teodor Costăchioiu

It’s been three years since I put online the first version of the map with the top schools in Bucharest and Ilfov, respectively two years since the last update of this map. Last year, I didn’t get the chance to update the maps for personal reasons, and by the time I had the time to do it, school enrollment was already over, and there was no point in working on it. I’ll make up for it this year and include information on the new map about the evolution of schools in 2023.

On the other hand, on a personal level, nothing has changed since the last edition of the top schools. We still live in Chiajna, and we haven’t found anything that we like and fits our budget. We have two years left, but time goes fast. Even though a new school has opened in Chiajna, our problem is not solved because we are not assigned to it. We still end up in the old school with poor results. So moving to a better school is one of our top priorities.

Returning to the top schools, I followed the same methodology as in previous years. I have kept the same philosophy of map markers:

  • school marker for primary and secondary schools
  • a round marker with a square in the middle for colleges (grades V-VIII plus high school)
  • a round marker with a dot in the middle for religious and bilingual schools.

As in previous years, I have not put arts and crafts and special schools on the map.

As for the color of the markers, I also kept the same color palette as before:

  • blue for primary schools
  • green for schools with an average above 9.01 in the national assessment
  • yellow for schools with a national assessment average between 8.01 and 9
  • orange for educational establishments with an average between 7.01 and 8
  • red for educational establishments with an average between 6.01 and 7
  • Dark red for schools in the “God forbid” category, with an average below 6.
  • I’ve marked in black the only new school in Ilfov.

I changed the data source for the top schools. I stopped using https://www.admitereliceu.ro and calculated the averages for each school directly from the data on http://evaluare.edu.ro/ (there’s no mistake in the link; the Ministry of Education doesn’t use SSL certificates, so you may get warnings in some browsers about the site’s security). I scraped almost the whole dataset because I want to analyze the national assessment results statistically. Another reason I changed the data source is how absences are handled. In last year’s data, a few schools with very high numbers of absentees jumped out at me, and I think it is interesting to look at this aspect as well.

Also, this year I have included the evolution of schools on the map. When you click on a school, you will also see the evolution of previous years.

That said, below is a map of state schools in Bucharest and Ilfov

You are currently viewing a placeholder content from Google Maps. To access the actual content, click the button below. Please note that doing so will share data with third-party providers.

More Information
Unblock content Accept required service and unblock content

Compared to the previous year, the festival of high grades ended, so the map tends more toward orange and red. For the first time, only some colleges completed the middle school cycle with grades above 9.01. No middle school has grades above nine.

Compared with 2022 and 2021, which were difficult years anyway due to the COVID-19 pandemic, we also see a downward trend in the average on the national assessment.

This year’s map also highlights another aspect: schools with very poor performance also have a small number of students who take the assessment exam. The same problem is seen in many schools in Ilfov.

I’m beginning to wonder what the point is of having schools that only take 15-20 pupils. There are communes with two or three small schools, one in each village of that commune. However, the distances between these schools are small. If I had to decide, I would merge these schools and organize decent public transport to the remaining school.

Private schools in Bucharest and Ilfov

As in the previous article, I created a separate map of private schools. I used a color scheme similar to that used for the state schools map.

  • blue for primary schools
  • purple for secondary schools that had no pupils in the national assessment
  • green for schools with an average above 9.01 in the national assessment
  • yellow for schools with a national assessment average between 8.01 and 9
  • orange for educational establishments with an average between 7.01 and 8
  • red for educational establishments with an average between 6.01 and 7
  • Dark red for schools in the “God forbid” category, with an average below 6.
  • I have marked in black a school that, although it has had students in the past but this year has no students present.

You are currently viewing a placeholder content from Google Maps. To access the actual content, click the button below. Please note that doing so will share data with third-party providers.

More Information
Unblock content Accept required service and unblock content

In general, private schools have a much lower number of students taking the national assessment than public (state) schools.

A special mention for Avenor College, with 40 absentees and six students enrolled in the national assessment. Last year, they had 33 absentees and ten students registered for the national evaluation. I don’t know why they have such a high number of absentees, and I would greatly appreciate it if someone more knowledgeable would comment on this.

There is also a special mention for Rut School, at the opposite end of the ranking. The Providence Baptist Church in Bucharest sponsors this school and offers free services to poor children, especially Rroma. The Rut School also offers literacy opportunities to those over the age of enrolment in the state system.

A few private schools that were marked purple last year now have students enrolled in the national assessment and have received colors corresponding to their average.

In the rest, we see a somewhat similar evolution to that of the state schools, with a slight decrease in national assessment averages.

August 1, 2024 1 comment
0 FacebookTwitterPinterestEmail
Old newspaper - Scinteia 1989-12-16
Data Explorations

Digiteca Arcanum: a journey into the past

by Teodor Costăchioiu April 8, 2024
written by Teodor Costăchioiu

At some point during a documentation phase for one of my projects, I found myself digging through historical references online—initially without a very clear direction. That exploration led me to a resource I now consider essential: Digiteca Arcanum.

Developed by Arcanum Adatbázis Kft., the platform provides access to a substantial corpus of digitized Romanian historical publications—newspapers, magazines, and official bulletins—many of which would otherwise be extremely difficult to access in a structured, searchable format. From a technical standpoint, what stands out immediately is the quality of the OCR layer and the ability to perform full-text search directly within scanned documents. This alone changes the usability of such archives from “interesting but impractical” to genuinely operational for research workflows.

From a broader perspective, it also highlights a gap: while digitization is frequently discussed at the institutional level in Romania, implementations like this—robust, searchable, and user-oriented—are still rare. In contrast, this platform demonstrates what a functional large-scale digitization effort looks like in practice.

From a content standpoint, the coverage is extensive and particularly valuable for longitudinal analysis:

  • Pre-communist period: access to sources such as Monitorul Oficial and a wide range of newspapers
  • Communist period: publications like Scînteia, useful for studying official narratives and propaganda mechanisms
  • Post-1990 transition: rich press coverage spanning political events (e.g., the Romanian presidential election in 2000), economic phenomena (e.g., the Caritas Ponzi scheme, the Bancorex bankruptcy), and urban legends such as Hotel Cișmigiu.

In my own work, I’ve found this archive to be more than a curiosity—it’s a practical research instrument. For example, while investigating recent flood events in Romania using satellite data and geospatial analysis, I used the newspaper archive to cross-reference historical occurrences in the same regions. This led to the identification of documented flood events dating back to 1891, providing valuable temporal context that would have been difficult to reconstruct from standard scientific datasets alone.

This kind of cross-domain integration—combining Earth Observation data with historical textual sources—is rarely straightforward, and having a searchable, well-indexed archive significantly reduces the friction. It effectively enables a form of “temporal data enrichment” that can strengthen both interpretation and validation in applied research scenarios.

If your work involves historical context, data validation, or long-term trend analysis, take a few minutes to explore Digiteca Arcanum — you may find it quickly becomes a core component of your research workflow.

Photo by Zetong Li on Unsplash

April 8, 2024 0 comments
0 FacebookTwitterPinterestEmail
Personal projects

Connecting .ro domains to Blogger / Blogspot

by Teodor Costăchioiu November 6, 2022
written by Teodor Costăchioiu

In today’s article I’ll show you a way to connect a .ro domain to a blog hosted on blogspot.com, Google’s free blogging service.

I use blogger.com for small projects because everything is free, the terms and conditions are fairly relaxed, and the service includes many things I’d have to pay for with other hosting providers. On the other hand, there are some limitations: the number of site themes is quite small, and nobody can be sure Google will keep this service forever. Even so, I think it’s worth it: if a site I build on Blogger starts attracting traffic, I can move it anytime to my own hosting—especially since I’m pretty good at doing this kind of thing (migration isn’t as easy as it looks, but it’s possible with a lot of work and help from AI).

One of the things Blogger.com offers for free is the ability to use your own domain name. And this is where the fun begins: for .ro domains, the domain registry https://www.rotld.ro doesn’t provide DNS hosting—only the option to specify the IP address of your own DNS servers.

In this situation, you need a DNS service provider to sit between RoTLD and blogger.com.

I chose ClouDNS for this, which offers a free plan with the following features:

  • Free forever
  • 4 Unicast DNS servers
  • 1 DNS zone (= one hosted domain)
  • 50 DNS records
  • 500K DNS queries per month
  • 1 email forwarding
  • Dynamic DNS
  • Web redirect
  • 24/7 Live Chat support

For a low-to-medium traffic site, the features offered by ClouDNS are more than enough. If traffic grows, you can upgrade to a paid plan with unlimited traffic. At the time I’m writing this article, the plan with unlimited DNS queries costs $5.95/month (+VAT).

So, to connect a .ro domain to Blogger / Blogspot, we’ll follow these steps:

  • buy the desired .ro domain from https://www.rotld.ro/home/
  • create a new ClouDNS account
  • create a new zone in ClouDNS that matches our domain
  • enter the ClouDNS nameservers in RoTLD
  • follow the steps required to connect a domain to Blogger, stopping at the stage where the message is shown containing the two CNAME records needed to connect the domain to Blogger / Blogspot
  • in ClouDNS, apply the Blogger connection template and enter the data above.

ClouDNS setup – Part I

First, go to the ClouDNS control panel and create a new zone that matches our domain.

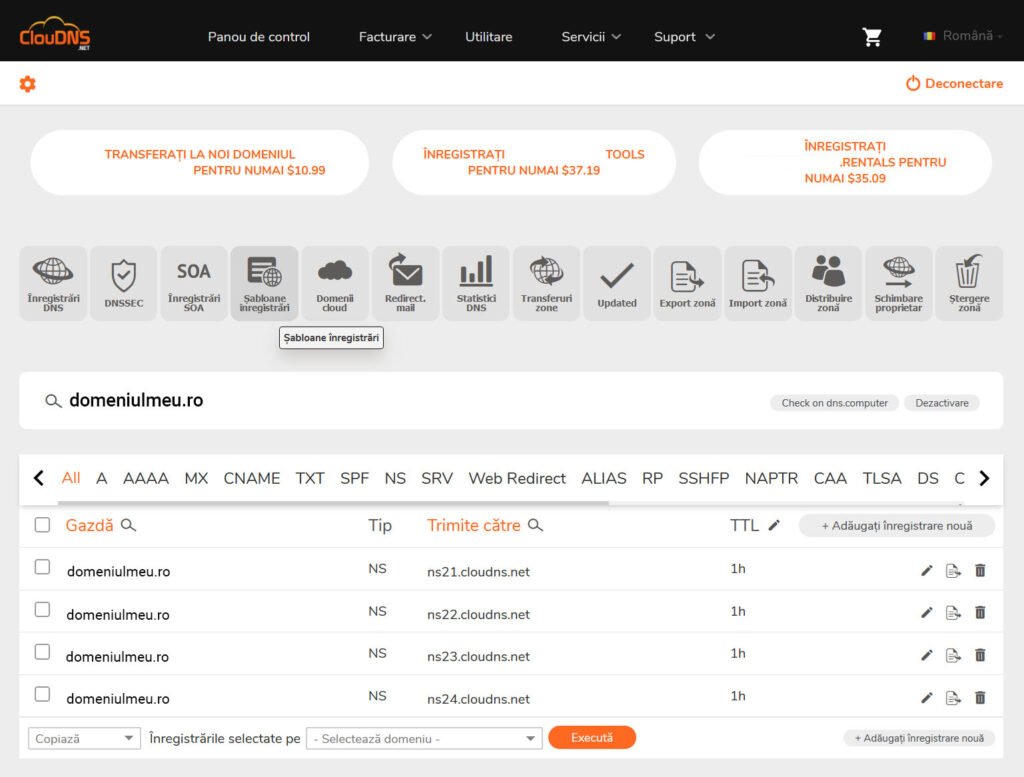
ClouDNS - create zone

RoTLD configuration

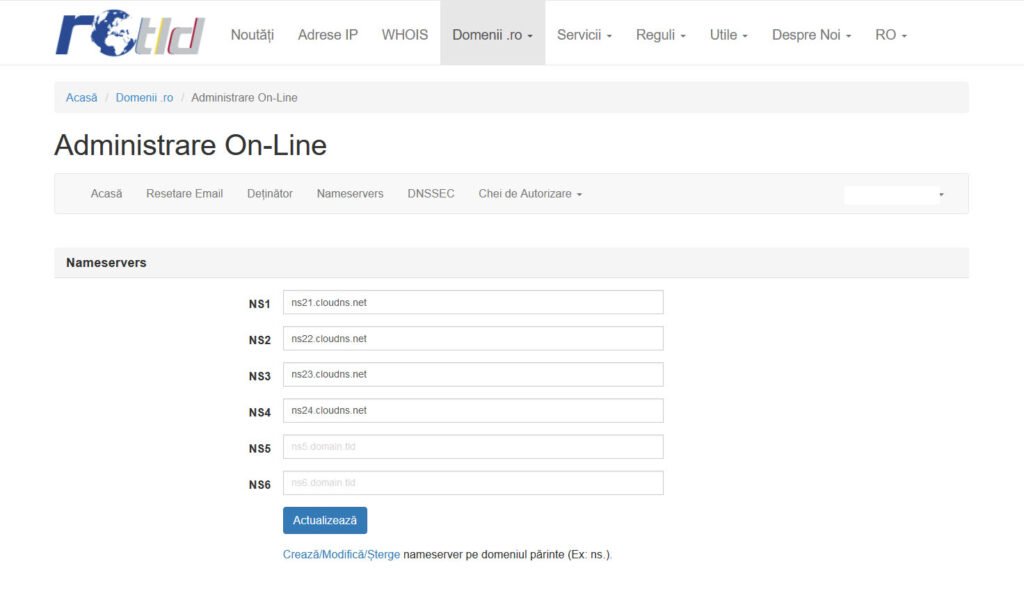
This tutorial assumes the domain has already been purchased, that we have access to its admin interface, and that we’ve already created the zone in ClouDNS. We’ll only change the nameservers, as follows:

  • ns21.cloudns.net
  • ns22.cloudns.net
  • ns23.cloudns.net
  • ns24.cloudns.net

As shown in the image below. If ClouDNS makes changes and these names are no longer valid, you can find the updated ones in ClouDNS by going to Control Panel → DNS Hosting, then for the zone (your domain) click available name servers.

RoTLD - nameserver configuration

Now it’s time for a break to allow the new settings to propagate. This can take up to 24 hours. You can check with https://www.nslookup.io/dns-checker/: enter the domain name and verify that the ClouDNS nameservers appear in the NS section.

Blogger setup

For this example, we’ll start with a blog called MyBlog, at https://numeledeblog.blogspot.com, and connect it to the domain domeniulmeu.ro.

To do this, open blogger.com, select the MyBlog blog, and go to Settings.

Connect domain to Blogger.com

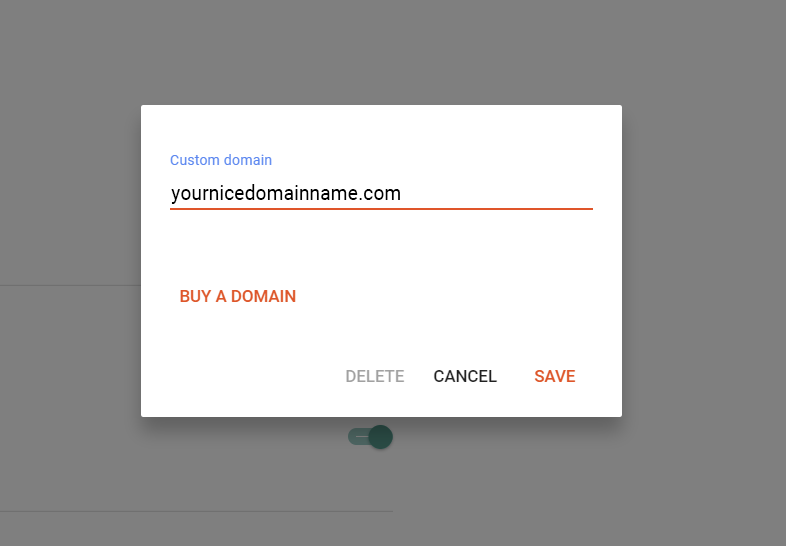
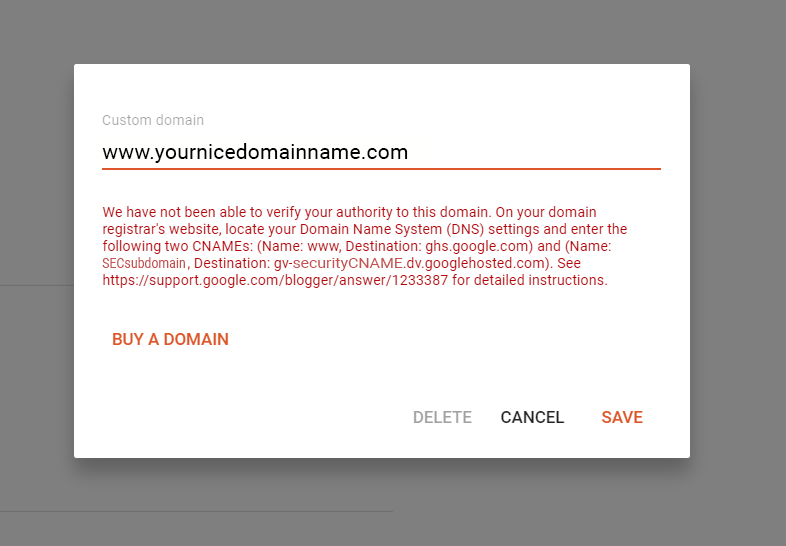
To connect our domain, in Settings go to Publishing and click Custom domain. A new window opens and asks for the custom domain name:

Connect domain to Blogger - entering the domain name.

Enter the domain name with a subdomain in front, whether it’s www, blog, or anything else you can think of. I prefer the www subdomain.

Now, if you click Save, you’ll get the following message:

Connect domain to Blogger - the domain name was entered incorrectly, without www in front.

To get rid of the error, you need to enter the name with www in front, as in the image below.

Connect domain to Blogger - entering the domain name.

Now everything is fine and Blogger lets us move on.

Connect domain to Blogger - domain settings.

The text in red contains two very important pieces of information:

  • the security subdomain; in my example it’s the string SECsubdomain
  • the security CNAME value; in my example it’s the string gv-securityCNAME.dv.googlehosted.com

Take the red text, copy it into a text document, and save it! You’ll need it later if you lose the settings and have to reconnect the domain.

Leave blogger.com open on the window where the red values are displayed.

ClouDNS setup – Part II

Open ClouDNS in another tab, go to the zone that matches your domain, and go to record templates.

Go to Templates

A list of available templates will open. From here, click “Blogger”.

ClouDNS templates

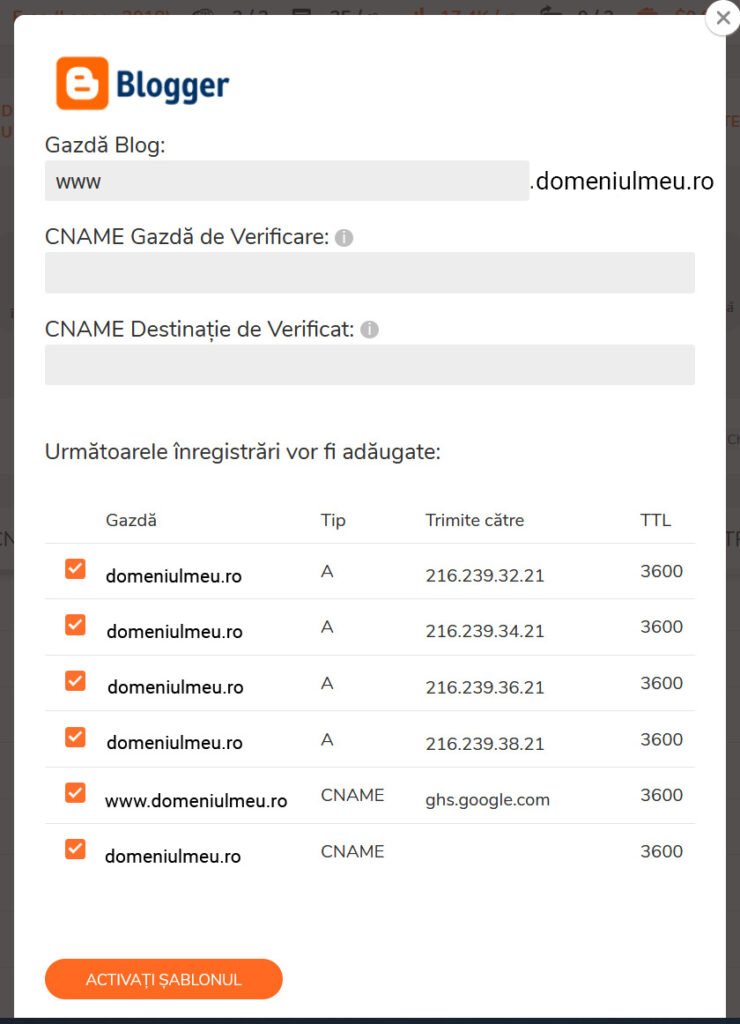
In the connection template window, enter the two values provided by blogger.com, then click “activate template”.

Fill in the data in the ClouDNS template

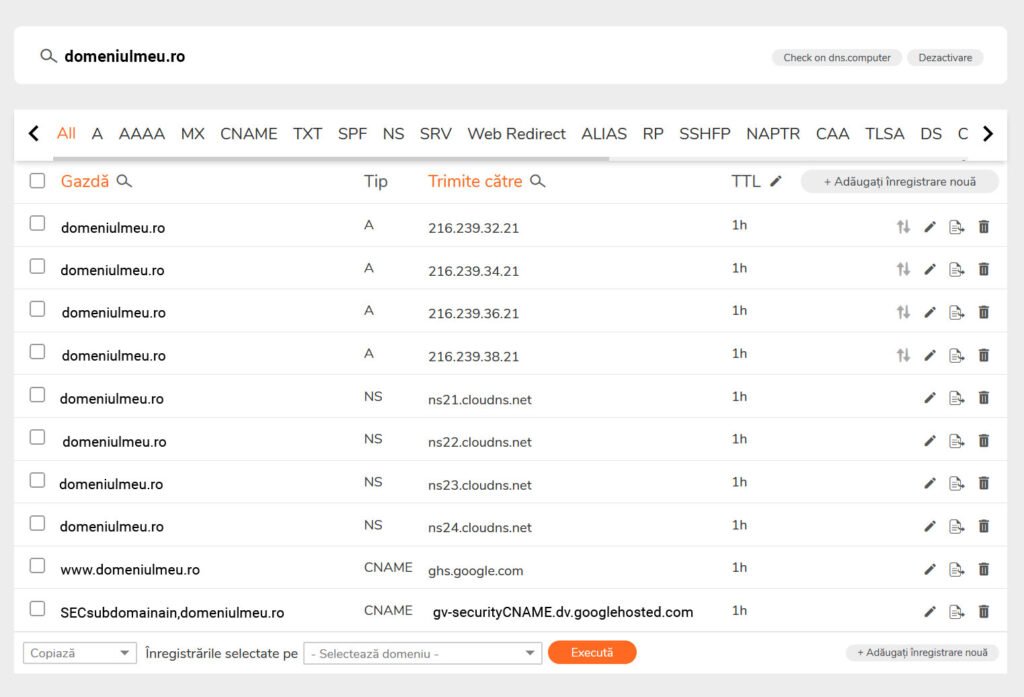
After applying the template, the DNS zone should look like this:

ClouDNS zone correctly configured for Blogger

Wait for the zone to update (a few minutes), then go back to the tab where blogger.com is open and click SAVE. If it doesn’t save, wait a few more minutes and try again. Sometimes the settings propagate more slowly.

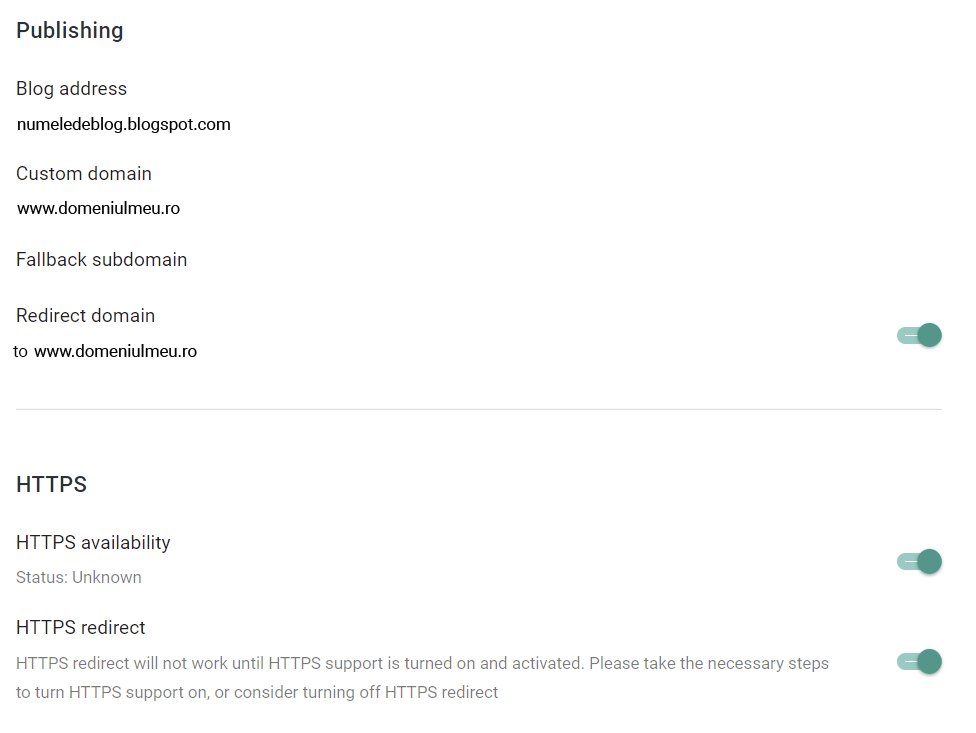
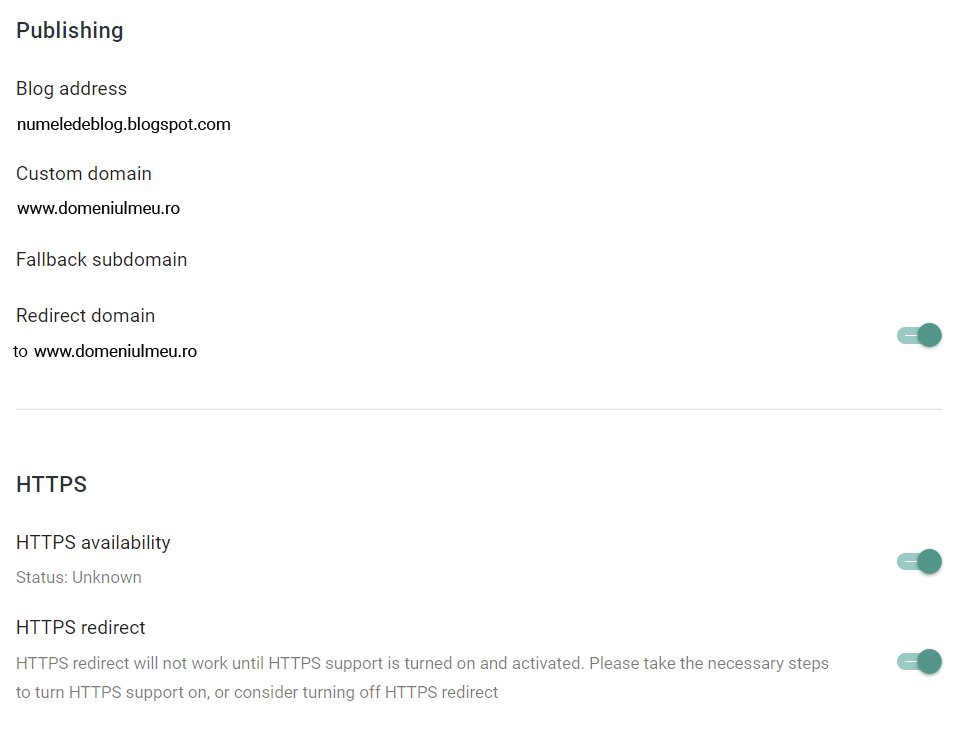
Finally, in blogger.com go to settings and enable the following:

  • redirect domain to www.domeniulmeu.ro
  • TTPS availlability
  • HTTPS redirect

As shown in the image below.

Blogger - enable https

Enabling HTTPS doesn’t happen instantly; it requires some waiting time. I’ve sometimes waited as long as two hours for it.

That’s it. You can now use the new site. Note that the site address is www.domeniu.ro. This is what you should use in Google Analytics and Search Console. If you enter domeniu.ro in the browser, you’ll be automatically redirected to www.domeniu.ro.

November 6, 2022 0 comments
0 FacebookTwitterPinterestEmail
Școală în Serbia
Data Explorations

Schools in Bucharest and Ilfov – a view from high above (2021-2022)

by Teodor Costăchioiu May 16, 2022
written by Teodor Costăchioiu

A Eurostat analysis, picked up by most of our news sites, says that the population of Ilfov County is expected to grow by 42% between 2020 and 2050 in the next few years, while the population of Bucharest will decrease by 23%. Obviously, the news is taken without a link to the material’s source because that’s how it is done here.

After reading this analysis, I thought I couldn’t miss the opportunity to write about it, especially since we are among those who chose to change Bucharest for Ilfov. We are familiar with the advantages and disadvantages of living on the outskirts of Bucharest.

About 15 years ago, we gave up a nice apartment located on a boulevard with impossible traffic, noise, and dust and moved to a house located in a quiet area of Roșu (Com. Chiajna).

Since then, things have changed a lot; on every piece of vacant land, 8-10-storey blocks are built. Cramped, no parking, no green spaces. More recently, blocks have started to be built in the area of houses. Wherever there’s a demolishable house, a new block appears.

With the real estate development, the population of the village has increased, but the infrastructure does not keep pace with the development. A first effect – traffic. When we moved to Chiajna, access to Bucharest was super easy, even at rush hour. Nowadays, to arrive in Bucharest at 8 am, we have to leave no later than 7 am. An hour spent in traffic for a journey of eight, maximum ten kilometers.

We are starting to feel a decline in our quality of life here, and we are not the only ones with this problem. Last year, a cousin of mine sold his house in Ilfov and moved to an apartment that is about half the house area, just because he couldn’t cope with taking his kids to and from school.

We still have a few years to go before we get into the school-going frenzy, but we are already starting to pay attention to the school infrastructure.

How the school landscape looks like in Bucharest and Ilfov

In a moment of inspiration, I started to map all the schools in Bucharest and Ilfov.

I took the list of schools in Bucharest and Ilfov and put them on a map created in Google Maps. I started with the ones near the area where we live, and slowly, I extended the project to the whole city and Ilfov County.

For my map I used the following types of markers:

  • school marker for primary and secondary schools
  • a round marker with a square in the middle for colleges (grades V-VIII plus high school)
  • a round marker with a dot in the middle for religious and bilingual schools.

I have not mapped arts and crafts schools and special schools.

Then I started coloring these markers.

I chose the color blue for primary schools – only with grades I-IV. Such educational establishments can be found all over Ilfov, generally in small villages.

The rest of the schools I colored according to how good they are. Now, we have to discuss what a ”good school” means. As a basis for ranking the schools, I have chosen the top compiled by https://www.admitereliceu.ro/top-scoli-generale. In this top, schools were ranked according to the average of the secondary school admission (”capacitate”) exam average per school, i.e., the average of the exam averages of the students in that school.

This ranking has some flaws. One of the things I’ve noticed is the tendency of some schools to “cheat the system.” Thus, students’ school performance is overrated so that they graduate with the highest possible average. This school year’s average then contributes 20% to the final grade for the admission exam.

I have even seen differences of more than 2.4 points between the school year’s average and the national assessment exam average. One such example is School No.1 in Afumați. The situation doesn’t seem to bother anyone; I haven’t read anywhere about parents questioning the school management or the school inspectorate.

Returning to the map, the school markers have been given the following colors:

  • green for educational establishments with an average above 9.01 in the national evaluation exam
  • yellow for educational establishments with an average of between 8.01 and 9
  • orange for educational establishments with an average between 7.01 and 8
  • red for educational establishments with an average between 6.01 and 7
  • Dark red for schools in the “God forbid” category, with an average below 6.

I’ve also added to the map a rough approximation of the areas where it becomes feasible to walk to and from school—these are the grey areas. To see exactly which school an address is assigned to go to https://www.ismb.ro/circumscriptii_scolare/circumscriptii.php.

You are currently viewing a placeholder content from Google Maps. To access the actual content, click the button below. Please note that doing so will share data with third-party providers.

More Information
Unblock content Accept required service and unblock content

Some conclusions

The school network in Bucharest remained at the level of the 1990s with very few new schools built. The school network is dense in the old parts of the city, and wherever you choose to live, you are likely to be able to walk your child to school within a maximum of one kilometer, which is a 20- or 30-minute walk.

The areas on the outskirts, however, are forgotten by fate and by the authorities. The town has expanded greatly in the last thirty years. Instead of fields where corn used to grow, villas and condominiums were built. Unfortunately, the authorities have forgotten that they also have to build schools in these areas. As such those who choose to live further out of town are forced to use their own car or public transport to get their children to school. The same goes for industrial areas that have become residential neighborhoods, but public transportation is also possible here.

In terms of educational results, most schools rank somewhere between 7 and 8 in the https://www.admitereliceu.ro/ top list. We find in Bucharest areas with poorly performing schools especially in the suburbs and disadvantaged areas – Ferentari, Giulești. There are also some schools with a low performance surrounded by good ones in the central area of the city. Overall, I’d say it’s a pretty balanced distribution of schools.

Ilfov county – a disaster

From the point of view of the educational offer, Ilfov is a county that does not keep up with the population dynamics. The school network is undersized, with large distances between schools, especially in the northern part of the county. Some establishments offer only primary education (one to four grades), usually in small villages in the county. It is debatable whether minibus transport can solve some of these problems.

Even worse is the situation in the localities close to Bucharest, which have experienced a strong expansion in the last 30 years. In these localities, the school network has remained at the 1989 level, which creates significant problems in being able to take children to school. It is very rare to be able to take your child by the hand and walk for 20-30 minutes to get to school.

That’s why many parents choose to “find a way” to take their children to school in Bucharest. This leads to terrible traffic at every entrance to the city and overcrowding of schools on the outskirts, with some even resorting to three-shift classes.

Moreover, if we look at the ranking made by admitereliceu.ro we notice that no state school in Ilfov manages to ensure admission averages above 8. The rankings are dominated by schools whose admissions average is somewhere between 6 and 7, with many disaster schools not even achieving admissions averages of 6.

What can we do?

Are you thinking of moving to Ilfov or to the outskirts of Bucharest because housing is cheaper? Consider that you will become a driver for your children.

If the authorities have not built schools in 30 years, don’t expect them to do it now.

This usually means giving a bribe to an individual who will allow you to establish your residence at their home – so you can obtain a temporary residence permit in the area where you will enroll your child in school. You will spend an hour in traffic every day on the way to school, time lost for both you and your children, especially since this time is taken from their sleep. You will lose just as much time picking them up from school. You and hundreds of other parents in the same situation will be stuck in traffic jams on streets that were not designed for current traffic levels.

Public transportation is not a solution. With small exceptions, the Ilfov localities are served by pre-rural lines, with old buses and a high cadence between runs. And even if you choose public transportation, you will still have to accompany your children, especially in primary school.

Add the time needed to take children to tutoring sessions and other activities, and you will see that, in the long run, the savings made from buying a cheaper home are spent on the additional costs related to access to education.

Overall, the condominiums built during the communist era in Bucharest are the best solution for easy access to school infrastructure. It is still worth taking a look at http://www.ismb.ro/circumscriptii_scolare/circumscriptii.php to see which school a certain condominium is assigned to, preferably before deciding to buy or rent a property there.

So, what about that forecast predicting a huge population increase in Ilfov alongside a population decline in Bucharest?

Private schools

This article wouldn’t be complete without writing about private schools. So I created another map on which I put all the private schools I found on the school inspectorates’ lists. I used a color scheme similar to the state school map:

  • blue for primary schools
  • purple for secondary schools that are not listed in the admitereliceu.ro. top list.
  • green for educational establishments with an average above 9.01 in the national evaluation exam
  • yellow for educational establishments with an average of between 8.01 and 9
  • orange for educational establishments with an average between 7.01 and 8
  • red for educational establishments with an average between 6.01 and 7
  • dark red for schools in the “God forbid” category. There is only one private school in this category, somewhere in Ferentari.

You are currently viewing a placeholder content from Google Maps. To access the actual content, click the button below. Please note that doing so will share data with third-party providers.

More Information
Unblock content Accept required service and unblock content

Not surprisingly, the network of private schools in Ilfov is mainly concentrated in wealthy municipalities such as Voluntari, Pipera, and Corbeanca.

Many private establishments offer only primary education. They may be a solution until more children grow up, but there is no data on the performance provided.

As for private schools that also offer secondary education, only a few of them are present in the top. Interestingly, however, these schools have achieved very good results in high school admissions, often scoring above 8 and even above 9.

We also find schools that are not present in the ranking, probably because they are newer and have not yet graduated a full generation of students.

Update: September 2022

I just found some time now and updated the maps with the 2022 results. For those interested in the old version, I’ve left links here to maps of state and private school results for 2021.

The evolution shows a “leveling up” of school results, with higher averages than in 2021. This is after the pandemic when we all know how (not so) much schooling has been done. This whole thing seems like an attempt to fool ourselves In addition, high grades create problems in sorting out students, you can end up losing your place at a good high school by one or two hundredths.

There are far too many changes between schools to take each one separately, so I’ve grouped them as follows:

Bucharest

  • Two private schools go straight into the green
  • Another private school goes orange

Changes for the worse

  • Two schools fall from “green” to “yellow”
  • Three schools drop in the ranking from “yellow” to “orange”
  • Six more schools have gone from “orange” to “red”
  • Two schools fall massively in the rankings from “orange” to “dark red”
  • A school goes from “red” to “dark red”
  • Two private schools had no candidates in the national assessment

Changes for the better

  • Five schools go from “yellow” to “green”
  • No less than 24 schools have changed from “orange” to “yellow”
  • Another 22 schools have gone from “red” to “orange”
  • Seven schools go from “dark red” to “red”

Ilfov

Also here we find a lot of changes in the ranking, overall the performance is better than in 2021

  • Two private schools enter the rankings for the first time, one on “orange” and one on “red”
  • Two state schools enter the rankings for the first time, one on “red” and one on “dark red”

Changes for the worse

  • A private school goes from “green” to “yellow”
  • Another private school goes from “yellow” to “orange”
  • Three schools go from “orange” to “red”

Changes for the better

  • A total of 16 schools go from “red” to “orange”.
  • A school takes a giant leap from “dark red” to “orange”
  • Eight more schools went from “red” to “orange”

Photo by Ivan Aleksic on Unsplash

May 16, 2022 2 comments
0 FacebookTwitterPinterestEmail
ESP8266-Thing-DEV
IoTTinkering

ESP8266 – running on battery power

by Teodor Costăchioiu May 15, 2019
written by Teodor Costăchioiu

This is an older post, originally published on my previous tinkering blog at electronza.com. While it dates back a few years, it remains just as relevant today.

At the time, I was working on an IoT node based on the ESP8266, designed to collect sensor data and upload it to cloud services.

One of the main challenges was running the node on battery power. It had to operate for extended periods with no human intervention. I had found a 9800 mAh LiPo battery that should have provided enough energy to keep it running for several months. Still, achieving that required minimizing the ESP8266’s power consumption and protecting the LiPo battery from over-discharge (typically below ~3 V).

On its own, this proved to be a challenging problem — one that deserved a dedicated blog post. So, this article is focused on two aspects: reducing the power consumption of ESP8266 modules and protecting LiPo batteries from over-discharging.


ESP8266 Low Power Modes

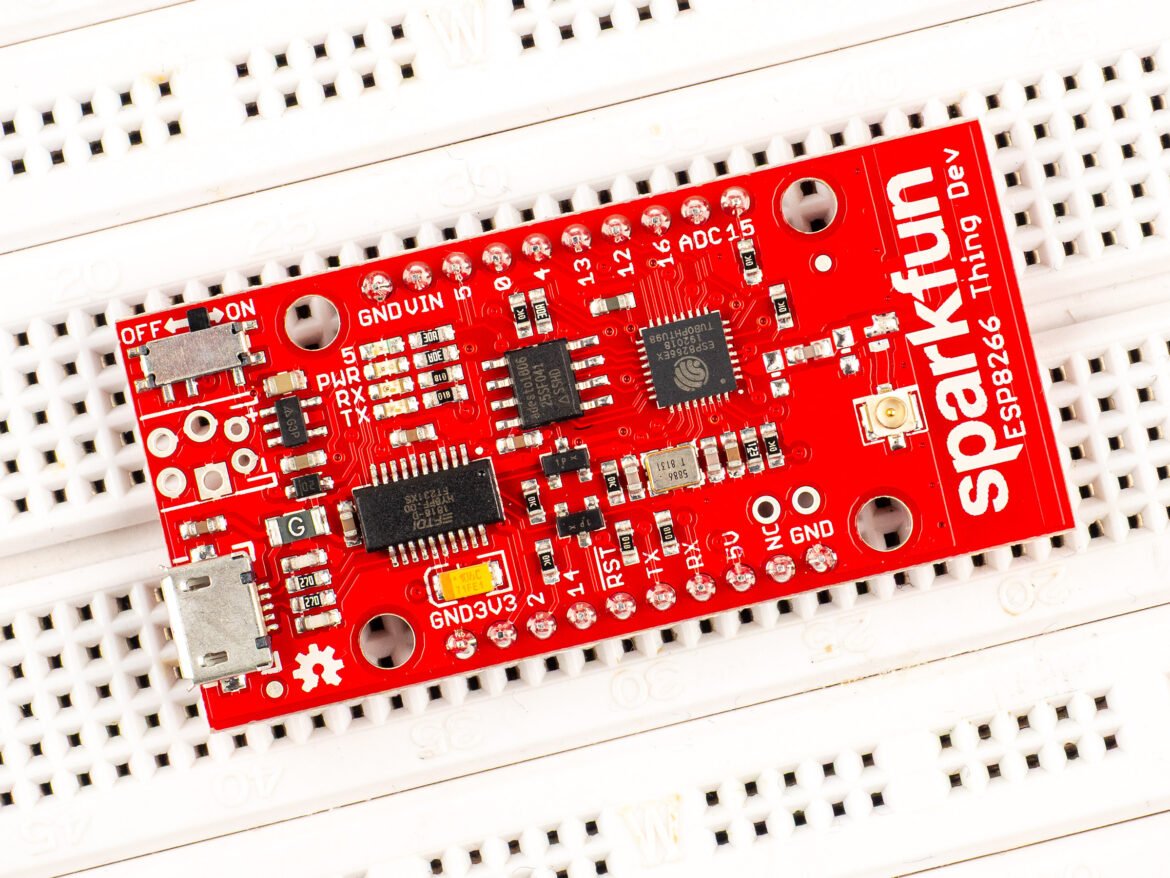
The first and simplest way to cut down a few milliamps was to remove the power LED.

Some ESP8266 boards had a trace that could be cut, such as the ESP8266 Thing Dev I used in the project. On other boards, the LED had to be physically removed – SMD hot tweezers were a must. Either way, this step reduced consumption by about 8–10 mA.

Next, I looked into the ESP8266 sleep modes. There were three sleep modes, summarized below:

Modem sleepLight sleepDeep sleep
WiFiOFFOFFOFF
System clockONOFFOFF
RTCONONON
CPUONPendingOFF
Substrate current15mA0.4mA~ 20µA
Avg. Current DTIM = 116.2mA1.8 mA–
Avg. Current DTIM = 315.4 mA0.9 mA–
Avg. Current DTIM = 1015.2 mA0.55 mA–

* On some routers, you cannot change the DTIM value

ESP8266 Deep Sleep

The most interesting mode for a sensor node that periodically woke up and sent data was deep sleep.

In the Arduino IDE, the ESP8266 could be put into deep sleep using:

ESP.deepSleep(sleepTimeSeconds * 1000000);

As shown in the example below:

#include <ESP8266WiFi.h>

/* ESP8266 Deep-sleep mode */
void setup() {
  Serial.begin(115200);
  Serial.setTimeout(2000);

  while(!Serial) { }

  Serial.println("I'm awake.");
  Serial.println("Going into deep sleep for 20 seconds");

  ESP.deepSleep(20e6); // 20 seconds
}

void loop() {}

However, there was a catch: to wake up the ESP8266, the RST pin had to be connected to GPIO16 (WAKE).

  • On the ESP8266 Thing Dev, this was done by closing the SJ2 jumper
  • On other boards, a wire connection between RST and GPIO16 was required

Another aspect is that the ESP8266 will lose everything in its memory, and it will run the code just as it does when it’s powered on for the first time.

Of course, one can save some context variables in the EEPROM. But if a node wakes up every five minutes, this will result in having 288 writes to the EEPROM per day. The AT25SF041 used by ESP8266 Thing Dev is rated for 100,000 Program/Erase Cycles. That means that the EEPROM will wear out in less than one year.

ESP8266 – Turning Off the Modem

This is a neat trick I found in the Arduino examples, in the ESP8266 board version 2.5.0 (or higher). It allows the ESP8266 to start with the modem off, then start the modem at the desired moment in the code. When dealing with slow sensors, such as the DGS-H2S from SPEC Sensors, one can use this trick to keep the modem off while the sensor data is collected and turn it on just before uploading to online services.

#include <ESP8266WiFi.h>

#ifndef STASSID
#define STASSID "your-ssid"
#define STAPSK  "your-password"
#endif

void preinit() {
  ESP8266WiFiClass::preinitWiFiOff();
}

void setup() {
  Serial.begin(115200);
  Serial.setDebugOutput(true);

  Serial.println("sleeping 5s");
  delay(5000);

  Serial.println("waking WiFi up, sleeping 5s");
  WiFi.forceSleepWake();

  delay(5000);
  Serial.println("connecting to AP " STASSID);

  WiFi.mode(WIFI_STA);
  WiFi.begin(STASSID, STAPSK);
}

void loop() {}

During testing, a simple ammeter showed that consumption stayed around ~20 mA with WiFi off and increased to ~75–80 mA when WiFi was active.

Protecting the battery

This is where things become interesting. By design, most ESP8266 boards do not allow direct measurement of the battery voltage (Vin) without external components. However, there was a workaround: one can detect a discharged battery indirectly, by measuring the input voltage of ESP8266 – that would be V3.3.

This was enabled by adding:

ADC_MODE(ADC_VCC);

and reading the value with:

uint32_t voltage = ESP.getVcc();

as shown in the example below:

// Load Wi-Fi library
#include <ESP8266WiFi.h>

// Replace with your network credentials
const char* ssid     = "myssid";
const char* password = "mypassword";

ADC_MODE(ADC_VCC);
uint32_t Batt;

// Set web server port number to 80
WiFiServer server(80);

// Variable to store the HTTP request
String header;

void setup() {
  Serial.begin(9600);
  while(!Serial);

  // Connect to Wi-Fi network with SSID and password
  Serial.print("Connecting to ");
  Serial.println(ssid);
  WiFi.begin(ssid, password);
  while (WiFi.status() != WL_CONNECTED) {
    delay(500);
    Serial.print(".");
  }
  // Print local IP address and start web server
  Serial.println("");
  Serial.println("WiFi connected.");
  Serial.println("IP address: ");
  Serial.println(WiFi.localIP());
  server.begin();
}

void loop(){
  WiFiClient client = server.available();   // Listen for incoming clients

  if (client) {
    Serial.println("new client");
    // an http request ends with a blank line
    boolean currentLineIsBlank = true;
    while (client.connected()) {
      if (client.available()) {
        char c = client.read();
        Serial.write(c);
        // if you've gotten to the end of the line (received a newline
        // character) and the line is blank, the http request has ended,
        // so you can send a reply
        if (c == '\n' && currentLineIsBlank) {
          // send a standard http response header
          client.println("HTTP/1.1 200 OK");
          client.println("Content-Type: text/html");
          client.println("Connection: close");  // the connection will be closed after completion of the response
          client.println("Refresh: 5");  // refresh the page automatically every 5 sec
          client.println();
          client.println("<!DOCTYPE HTML>");
          client.println("<html>");
          
          // output the battery value
          Batt = ESP.getVcc();
          client.println("Battery voltage is: ");  // refresh the page automatically every 5 sec
          client.println(Batt);
          
          client.println("</html>");
          break;
        }
        if (c == '\n') {
          // you're starting a new line
          currentLineIsBlank = true;
        } else if (c != '\r') {
          // you've gotten a character on the current line
          currentLineIsBlank = false;
        }
      }
    }
    // give the web browser time to receive the data
    delay(1);
    // close the connection:
    client.stop();
    Serial.println("client disconnected");
  }

}

the ESP8266 is configured to read the V3.3 voltage by placing ADC_MODE(ADC_VCC); on top of the sketch. Then, the battery voltage in mV is read as in uint32_t getVcc = ESP.getVcc();

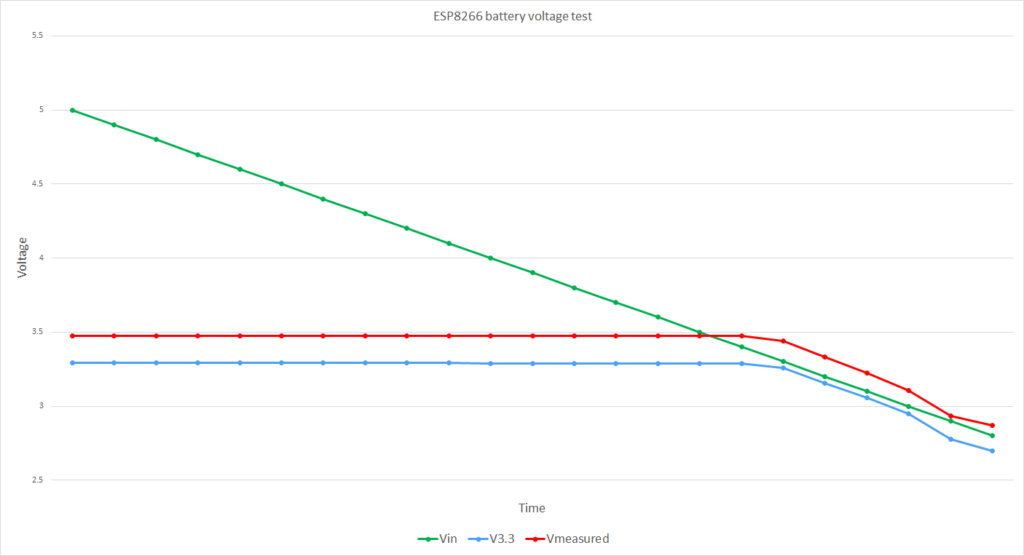
In my experiments, I found the following relationship among Vin, V3.3, and the voltage measured by the ESP.getVcc(); This applies to the ESP8266 Thing Dev, which uses AP2112K-3.3V LDO regulator. Some other boards might behave differently, so you will have to redo my experiment.

ESP8266 battery test
VinV3.3Vmeasured/1000
53.29043.475
4.93.29053.475
4.83.29053.475
4.73.29043.474
4.63.29053.475
4.53.29043.474
4.43.29053.475
4.33.29053.475
4.23.29063.475
4.13.29053.475
43.293.474
3.93.28993.474
3.83.28993.474
3.73.28983.474
3.63.28973.473
3.53.28973.473
3.43.28953.472
3.33.25753.44
3.23.1533.331
3.13.05553.226
32.9473.106
2.92.7752.936
2.82.72.87

In my experiments (performed on the ESP8266 Thing Dev, which used an AP2112K-3.3V LDO regulator), I observed the following:

  • There was an offset of about 0.18 V between the measured value and the actual V3.3
  • The voltage remained stable while Vin was above 3.3 V (regulated region)
  • Once Vin dropped below 3.3 V, the regulator output began to drop

Most importantly:

  • When the battery voltage reached ~3.0 V (a safe discharge limit for LiPo batteries), the value returned by ESP.getVcc() was about 3100 mV

This provided a practical threshold for detecting low-battery conditions.

// Low voltage detection
// Note that we read Vin, and not the battery voltage,
// as the battery voltage is not accessible to be measured
// ESP8266 thing uses AP2112K-3.3V
// https://www.diodes.com/assets/Datasheets/AP2112.pdf
// Low DropoutVoltage (3.3V): 250mV (Typ.) @IOUT=600mA+

#include <ESP8266WiFi.h>

ADC_MODE(ADC_VCC);
int Batt;

// do other things here

void setup() {

  // ********************************************************************************
  // Check battery status
  // ******************************************************************************** 
  // Reads Vin (not battery voltage!!!)
  // But Vin = battery voltage if battery_voltage < 3.3V
  Batt = ESP.getVcc();
  // If the battery is discharged don't go any further!!!
  if(Batt < 3100){
     // Deep sleep for as long as you can
     ESP.deepSleep(ESP.deepSleepMax());
  }
  // your code goes here
}

void loop() {
  // your code goes here
}

In this approach:

  • The voltage was checked immediately after boot
  • If the value was below the threshold, the ESP8266 entered deep sleep for the maximum possible duration
  • It periodically woke up, checked again, and returned to sleep if needed

It is worth noting that other components (such as sensors) still consumed power, but the overall discharge rate was significantly reduced.

May 15, 2019 0 comments
0 FacebookTwitterPinterestEmail

Search

Recent Posts

  • Schools in Bucharest and Ilfov (2026) – analysis and trends

  • Why I Shut Down a Few Websites — And What Comes Next

  • Schools in Bucharest and Ilfov – a view from high above (2025)

  • Schools in Bucharest and Ilfov – a view from high above (2024)

  • Digiteca Arcanum: a journey into the past

    Social Connect

    Linkedin Github

    Categories

    • Announcements (1)
    • Data Explorations (5)
    • Personal projects (1)
    • Tinkering (1)
      • IoT (1)

    Remote sensing engineer exploring Earth through data and code. Currently at GeoSense, NUST Politehnica Bucharest.

    Contact

    • Contact

    Currently living in Bucharest, Romania

    Linkedin Github Rss Facebook

    Resources

    • Google Scholar
    • ORCID

      Personal projects

      • Photography portfolio
      • Cooking blog

      © 2026 Teodor Costachioiu. All rights reserved.

      Teodor Costăchioiu
      • Home
      • Notes
      • About
        • Career
        • Publications
      • Contact
      • English
        • Română
      • English
      • Română (Romanian)