In the short term, the number of students fell. In the long term, Bucharest and Ilfov gained share of the national total. Grades fell everywhere in 2026, but the drop comes primarily from a harder exam, not from the schools. The number of candidates also fell, even though 2025 had been a peak. In the long term, Bucharest and Ilfov gained share of the national total. What changes the least are the gaps—between areas and between schools—and the loss of student numbers isn’t uniform: it is concentrated in mid-tier schools.
It’s been a while since the National Evaluation results were published, but I finally managed to make a bit of time to download the data from evaluare.edu.ro, process it, and update the school maps. I’ve already reached the fifth edition of this analysis (see previous editions here).
As every year, I updated both the map of public schools and the map of private schools. The detailed analysis, at the level of each education unit, remains based mainly on results from 2023–2026.
This year, however, I also added more historical context. On the data.gov.ro portal I found older datasets that I didn’t have in my collection. So, for regional-level comparisons, I was able to extend the analysis over time and included results from 2018–2022.
If in the first years this series was mostly about observing and understanding the education landscape in Bucharest and Ilfov, this year the stakes become personal: our child is starting preparatory class.
We still live in Chiajna. We haven’t found a home in Bucharest that we like, that’s located in a suitable area and, at the same time, fits our budget. Moving closer to the city center—which we had considered in previous years—didn’t happen.
We chose a nearby private school. Not because money is no object, but because the public school we’re assigned to is a disaster: the three schools in Chiajna have school-level averages of 6.15, 6.55, and 6.63, all down from last year, and we’re assigned to the weakest of them. So we put our child’s well-being first, even if that requires sacrifices.
After a few years of looking at schools as points on a map, we can say that starting this year we’ve become direct beneficiaries of these analyses.
Methodology
I used the individual results files for 2018–2025 from data.gov.ro and the data extracted from the evaluare.edu.ro pages for 2026. I complemented these sources with the school-aggregated tables and the maps produced for previous editions.
In what follows, by “candidate present” I mean a student for whom there is a valid final average in the National Evaluation. When I compare the performance of regular education units, the main analysis does not include special schools, nor arts- or music-profile units.
For the comparison between schools in 2018 and those in 2022, I used the SIIIR code, which makes it possible to identify the same education unit even if its name changed in the meantime. I included only schools that had at least 20 candidates in both years, to reduce the influence of very small cohorts on the results.
For the recent series, matching schools across years was verified separately. Some units changed their name, legal form, or the way they appear in the official files, so an automatic match based solely on the name could have produced errors.
The 2019 data were used for the final average, the average for grades 5–8, background (urban/rural), and candidates’ sex. I did not use the subject-level statistics because, in the available file, some grades were converted into calendar dates during a previous conversion. I preferred to exclude these values rather than introduce reconstructed results with too high a degree of uncertainty into the analysis.
Year-to-year comparisons are descriptive. The topics, organizational rules, and the context in which the exams took place are not identical. In particular, results from 2020–2022 must be interpreted in light of the COVID-19 pandemic, the suspension of in-person classes, periods of online schooling, and changes to the curriculum and exam organization. In 2026, the difficulty of the tests appears to have increased noticeably nationwide, which means a school can drop into a lower color category even if nothing changed inside the school.
School-level averages have uncertainty that depends strongly on the number of candidates. For a unit with 200 students, the annual average is stable; for one with 7, a single grade can shift the average by more than half a point. I always report the number of candidates alongside the average and avoid calling a very small-cohort school “first” or “last.”
How to read the maps
The map-making methodology has remained unchanged from previous editions. I kept the same symbols and the same color palette, so results can be compared more easily from one year to the next.
The markers indicate the type of education unit:
- simple marker for primary and lower-secondary schools;
- round marker, with a square in the center, for colleges that include both lower-secondary and upper-secondary classes;
- round marker, with a dot in the center, for religious education units and for bilingual ones.
The colors indicate the average obtained by the school’s candidates in the National Evaluation:
- blue — primary schools or units with no candidates in the National Evaluation;
- green — average of at least 9.01;
- yellow — average between 8.01 and 9.00;
- orange — average between 7.01 and 8.00;
- red — average between 6.01 and 7.00;
- dark red — average of at most 6.00, the category I’ve called, since the very first editions, “God forbid.”
The main novelty of this year’s edition is the analysis of how the number of candidates varies from one cohort to the next. I now have enough data to make this comparison and, in many respects, the evolution of student numbers is even more interesting than the evolution of grades.
So I’m not only comparing the averages obtained, but also the number of students who ended up sitting the National Evaluation in each education unit. This perspective brings to light changes that weren’t visible in previous editions: schools whose cohorts are growing, units that are losing students, and categories of schools where the decline in student numbers is more pronounced.
What the public-school landscape looks like in 2026
You are currently viewing a placeholder content from Google Maps. To access the actual content, click the button below. Please note that doing so will share data with third-party providers.
More InformationThe map has gotten darker. Not dramatically, but enough for the change to be visible—2026 was a tough year nationwide. The share of candidates with averages above 5 fell from 83.1% to 79%, and the number of perfect 10 averages collapsed from 85 to 7—the lowest level since 2013. The distribution shifted downward across the country, and part of what we see on Bucharest’s map is a consequence of that shift, not of what happened in schools.
The number of schools in the yellow category, with averages between 8 and 9, fell from 56 to 40. At the same time, the red category, corresponding to averages between 6 and 7, grew from 67 to 75 schools, and the dark red category, with averages below 6, from 44 to 49. The orange zone remained almost unchanged, with 90 units.
The overall picture suggests that a significant group of schools that in 2025 were in the good-results category dropped one step in 2026. The change is not a general collapse, but it indicates a visible shift of the distribution toward weaker-result categories.
The temptation is to read this as a deterioration of Bucharest schools. I think that would be wrong. The color thresholds are fixed, and the distribution moved down by about 0.17 points; a shift of that size mechanically pushes out of the yellow band all schools that were less than 0.17 points above the threshold of 8, regardless of what happened in the classroom. Losing 16 out of 56 yellow schools is compatible with a simple shift of the entire distribution. The map tells us that in 2026 fewer schools crossed thresholds defined four years ago—not that fewer schools are good.
The weighted average by number of students, calculated for public schools in Bucharest and Ilfov, fell from 7.61 to 7.44. Looking at each unit individually, 68% of schools obtained a lower average than in 2025, and the median drop was 0.19 points.
At the bottom of the ranking, the situation also worsened: the number of public schools with an average below 5 rose from 15 to 22.
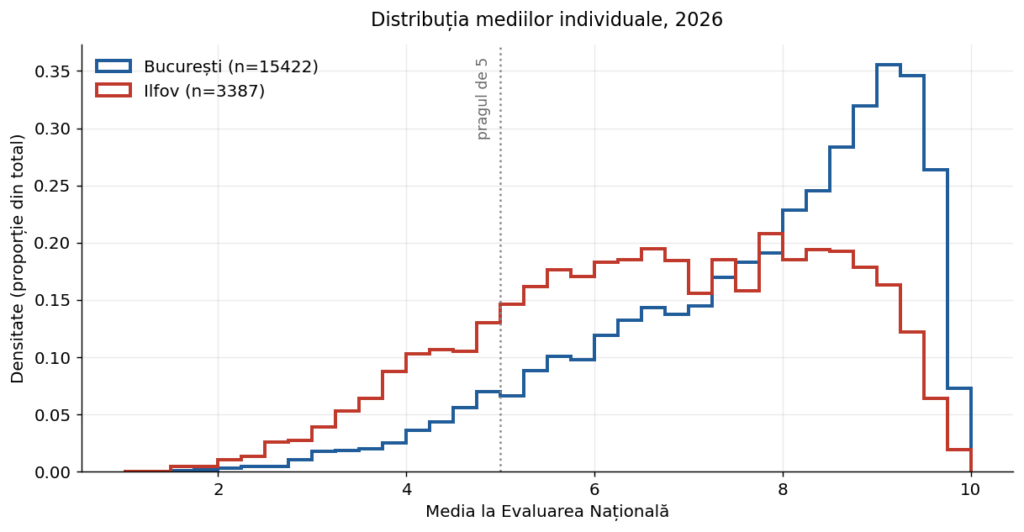
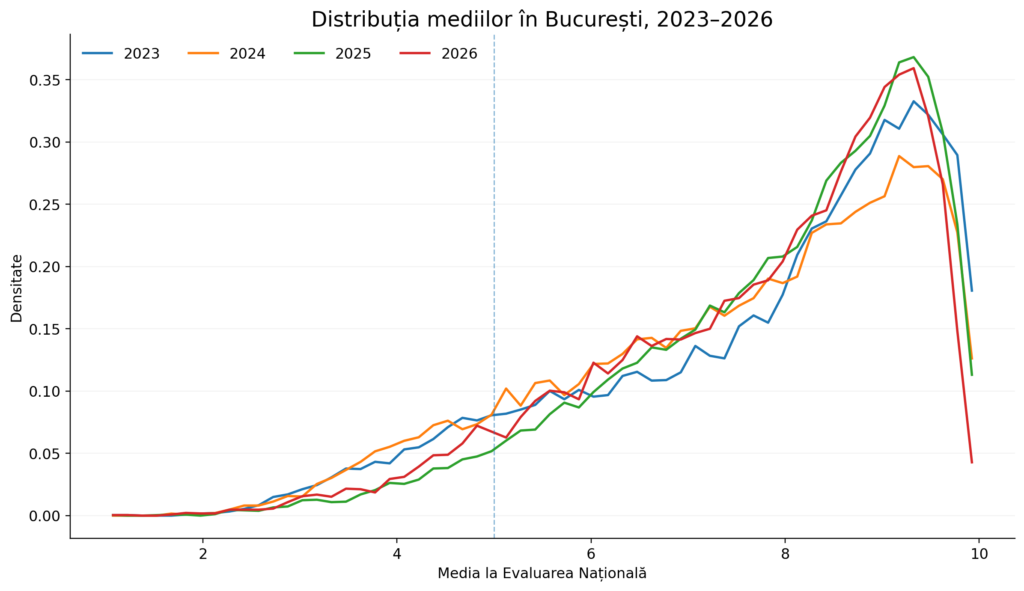
The distribution of averages is not surprising. Nationwide, the share of candidates with averages above 5 fell from 83.1% to 79%, and the number of perfect 10 averages collapsed from 85 to just 7—the lowest level recorded from 2013 to the present.
Three of the seven students with a perfect 10 average in the entire country come from Bucharest: from “I. G. Duca” Lower Secondary School, “Leonardo da Vinci” Lower Secondary School, and Lower Secondary School No. 142. It’s worth noting, however, that School No. 142 has an overall cohort average of 7.58. A single student with a perfect 10 says very little about a school’s overall performance.
At the top of the ranking, the situation remains predictable. All seven public schools with averages above 9 are national colleges, and four of them had fewer than 30 graduates. “Gheorghe Lazăr” National College leads the ranking, with an average of 9.50 and 29 candidates.
Such results must be viewed in context, however. It is much easier to obtain a very high average when only a single, carefully selected class reaches the exam—made up of students who typically benefit from strong family and educational support. I’m not saying the result isn’t valuable, only that it can’t be compared directly with the performance of a school that sends two hundred or three hundred children to the exam.
The truly interesting performance, in my view, shows up elsewhere. Lower Secondary School No. 79 in Sector 4 obtained an average of 8.94 with 196 graduates. Lower Secondary School No. 195 in Sector 3, the largest unit in Bucharest, had an average of 8.44 with 294 students and, unlike most schools, increased its cohort, from 255 graduates the previous year. Lower Secondary School No. 56 in Sector 2 obtained an average of 8.49 with 221 candidates.
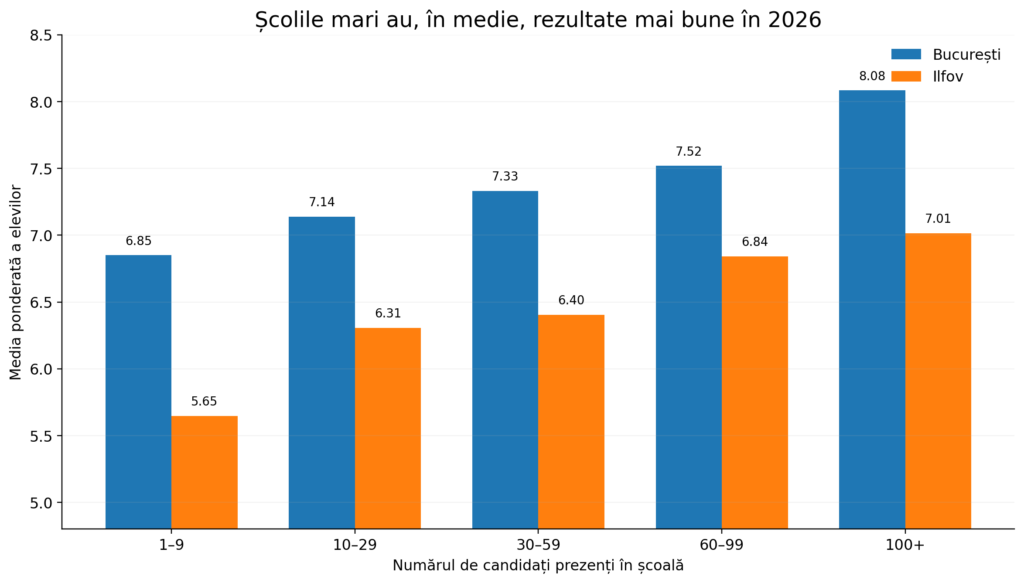
These are the figures I consider most relevant: good results achieved with large cohorts, not just spectacular averages calculated on a few dozen students.
At the other end of the ranking, the situation remains serious. The weakest results were recorded at Lower Secondary School No. 2 Tânganu–Cernica, with an average of 3.59 and 17 candidates; at Lower Secondary School No. 3 Bobești–Glina, with an average of 4.05 and 7 candidates; and at Lower Secondary School No. 1 Ștefăneștii de Jos, with an average of 4.06 and 48 candidates.
In Bucharest, the lowest average appears at Lower Secondary School No. 22 in Sector 3—4.08—calculated, however, for seven graduates. I don’t list it as “the worst school in Bucharest”: with seven students, next year’s average could be a full point higher without any real change.
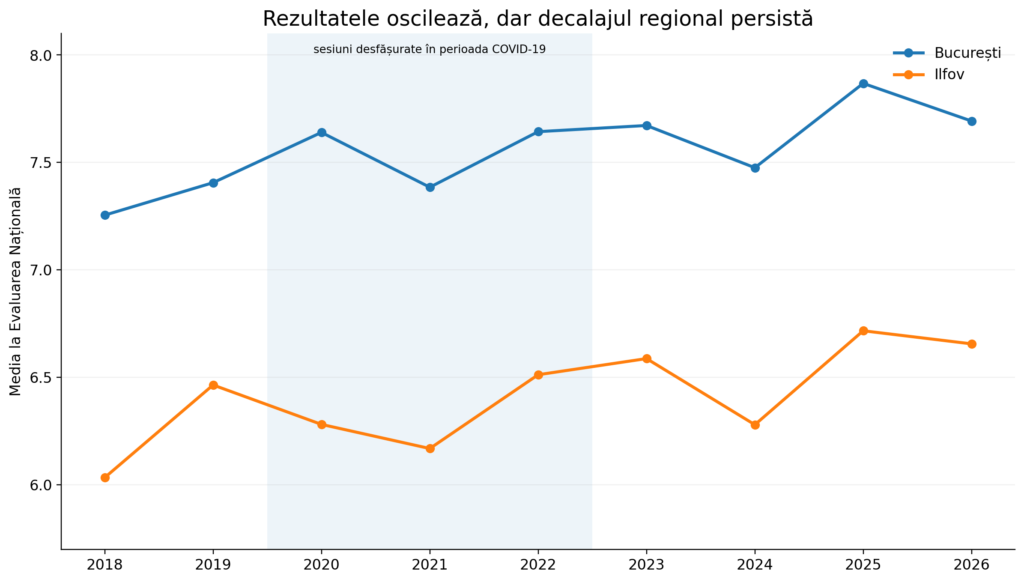
Ilfov remains well below Bucharest’s level. Even in better years, Ilfov has about twice, or more than two and a half times, as many candidates below the average-5 threshold. This is a more important difference than a few tenths in the county average, because it describes a large population of students who reach the end of lower secondary with serious difficulties in the exam subjects.
No school in the county exceeded an average of 8, just like the previous year. The top-ranked is again Lower Secondary School No. 1 Buftea, with an average of 7.74, down from 7.90 in 2025. The number of candidates also fell, from 141 to 114.
The small size of some cohorts complicates interpretation even further. Seven schools in Ilfov had fewer than ten students present at the exam. In such cases, a school’s average can change sharply from one year to the next depending on the results of a few children, and it says little about the unit’s real stability.
In Ilfov, a strong internal polarization is also visible, reflected in the large differences between results in schools from urban localities and those in rural areas. The county average actually hides two distinct educational realities: urban localities with relatively good results, and rural communities where averages are considerably lower and the share of candidates scoring below 5 is much higher.
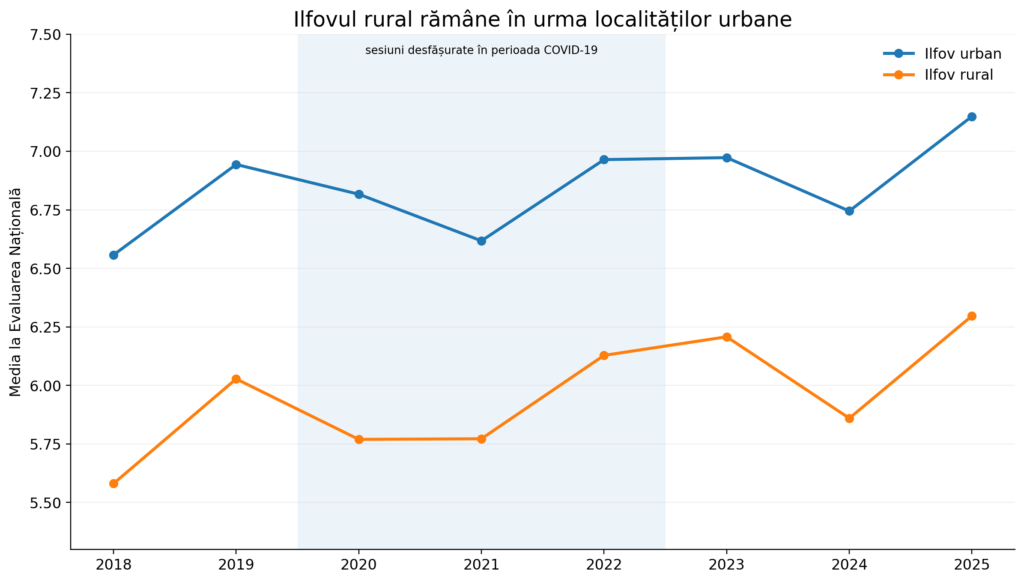
A major gap continues to persist between report-card averages and the results obtained in the National Evaluation. This gap suggests that, in many schools, students are graded generously over the years of study, and classroom grades do not always reflect the level demonstrated in a standardized exam.
The distribution of results changes relatively little from one year to the next, suggesting a stable educational landscape. Unfortunately, what’s stable isn’t only the overall results, but also the gaps between Bucharest and Ilfov, between urban and rural, and between schools at the extremes of the ranking.
Private schools in 2026
The private-school map contains 88 units, of which 43 had graduates in the National Evaluation—three more than last year. The rest are primary schools, kindergartens with a primary cycle, or units that haven’t yet taken a cohort all the way through.
You are currently viewing a placeholder content from Google Maps. To access the actual content, click the button below. Please note that doing so will share data with third-party providers.
More InformationThe weighted average fell here as well, from 8.84 to 8.65, so the general downward trend in grades affected these too. But the picture remains clearly better than in the public system: 13 private schools have averages above 9 and 20 have averages between 8 and 9.
The observation I make every year remains valid: cohorts are very small. Seven private schools had at most five graduates. There is one with two students and three with three students each. An average of 9, calculated on three students, is not statistically meaningful.
The exceptions that matter are few. The International Theoretical High School of Informatics Bucharest remains the largest, with 214 graduates and an average of 8.51—but it too is down from 243 students and 8.79 last year. The “European School Bucharest” Theoretical High School recorded a spectacular increase, from 48 to 73 graduates, with an average of 9.28. The “Romanian-Finnish” High School held steady at 67 students and 8.48.
One good thing to note: the absence rate in private schools fell from 7.95% to 3.63%. In previous years I flagged private schools with dozens of absentees and a handful of students present, a sign that students were following an international curriculum and weren’t interested in the National Evaluation. The phenomenon has eased—but not everywhere.
How the number of students has evolved
The first thing that stands out in the 2026 data is the reduction in the number of candidates compared to 2025. Bucharest went from 17,307 candidates present in 2025 to 15,422 in 2026, which means a 10.9% drop in a single year. In Ilfov, student numbers fell from 3,517 to 3,387 candidates, i.e., by 3.7%. Nationwide, the drop was 5.9%, from 152,233 to 143,251 candidates.
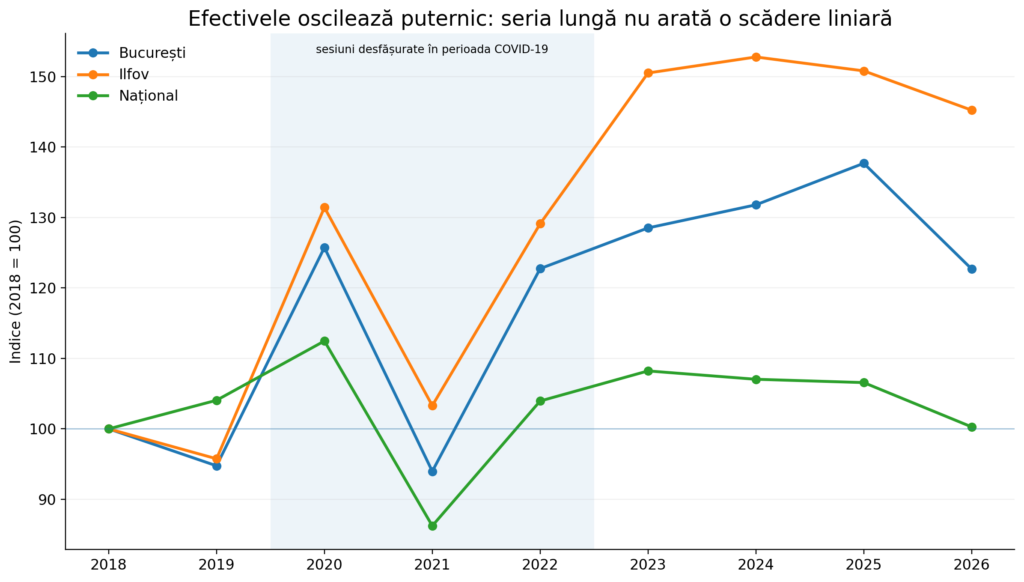
Viewed in isolation, these two editions suggest a rapid retreat of the school population from the Capital. Bucharest seems to be losing students almost twice as fast as the country as a whole, and the total number of candidates in Bucharest and Ilfov falls by 9.7%. But 2025 was not a typical year: it was the maximum of the entire series for Bucharest, with 17,307 candidates.
From this perspective, 2026 looks more like a return from a peak than an unprecedented collapse. Bucharest ends up almost exactly at the 2022 level: 15,422 candidates in 2026, versus 15,428 in 2022. In Ilfov, the 2026 cohort remains 12.5% above the 2022 level. The conclusion therefore depends very much on the comparison’s starting point.
In the long run, things look a bit different. Between 2018 and 2026, the number of candidates in Bucharest increased by 22.7%, and in Ilfov by 45.2%. Over the same interval, the national total remained practically unchanged: 143,251 candidates in 2026 versus 142,847 in 2018, a difference of just 0.3%. Together, Bucharest and Ilfov have 26.2% more candidates than at the start of the series.
This evolution is also visible in the share of the Bucharest–Ilfov area in the national total. In 2018, the two regions represented 10.4% of the country’s candidates. In 2025 they reached 13.7%, and after the 2026 drop they remained at 13.1%. In other words, even after last year’s setback, Bucharest and Ilfov concentrate a significantly larger share of candidates than eight years ago.
This does not mean that all localities around Bucharest are growing at the same pace, nor that every school benefits from this concentration. Regional data can hide important shifts between localities, between public and private schools, or between units with different reputations. They do show, however, that the 2026 drop cannot be presented as a linear depopulation of the Bucharest–Ilfov system, but it is an alarm signal and we will need to watch what happens in the years to come.
The pandemic years break the series
The largest swings appear in 2020–2022. In 2020, student numbers rise sharply: by 32.7% in Bucharest and by 37.3% in Ilfov compared to 2019. In 2021, a drop follows: 25.3% in Bucharest, 21.4% in Ilfov, and 23.3% nationwide. In 2022, the number of candidates returns almost to the 2020 level.
These movements should not be read as pure demographic variation. The 2020–2022 sessions took place in the context of the COVID-19 pandemic, with interruptions to in-person classes, online schooling, adapted curricula and rules, as well as unusual participation conditions. The number of candidates present at the exam depends on cohort size, but also on schooling pathways, participation, dropout, enrollment, and the specifics of each session.
That is why the National Evaluation series is not a complete census of children of the same age and cannot, on its own, support a demographic forecast. It is, however, very useful for showing how many students actually reach the end of lower secondary and sit the exam in each region.
The recent period: fewer candidates, but a smaller contraction than nationwide
If we choose 2023 as the reference point—the first year in the recent series used in detail in this analysis—Bucharest loses 4.5% of candidates by 2026, and Ilfov 3.5%. Over the same period, the national total falls by 7.3%. The Bucharest–Ilfov area is contracting, but more slowly than the country as a whole, and its national share continues to edge up, from 12.7% to 13.1%.
This perspective is less spectacular than the 2025–2026 comparison alone, but it is also more robust. 2025 was a local peak, and 2026 a pullback. Over three years, Bucharest and Ilfov do not appear as regions emptying out faster than the rest of the country.
The decline is not evenly distributed across schools
The regional series tells us how large the cohort is in Bucharest or Ilfov, but it doesn’t show where the change occurs. For the recent period, I was able to track the same 217 Bucharest schools and compare cohort sizes in 2024 with those in 2026. The units were grouped by the average obtained in 2024, so we can see whether the decline is general or concentrated in a particular part of the ranking.
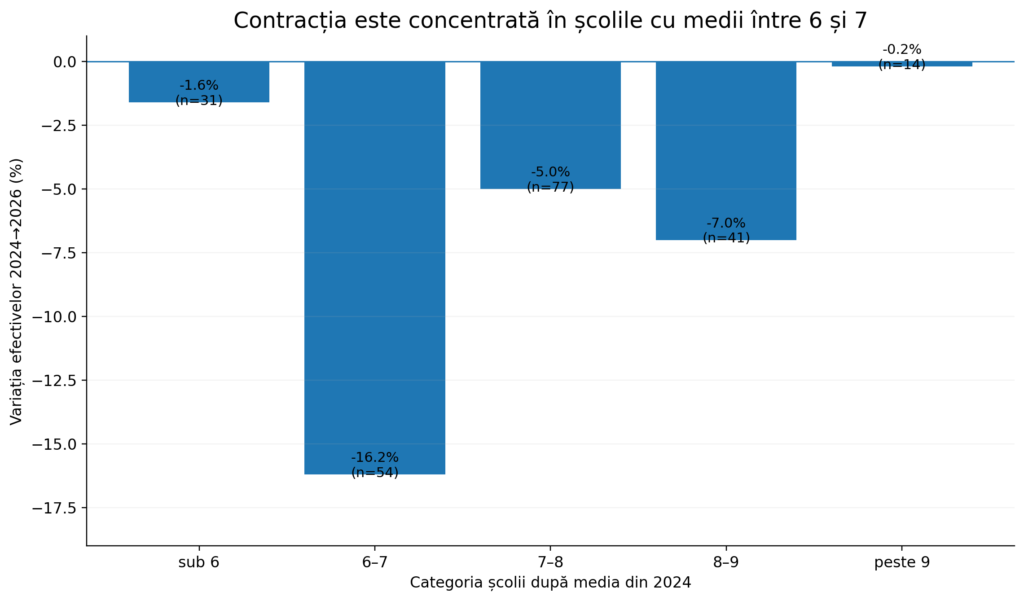
The result is surprising. Schools with averages between 6 and 7 lost 16.2% of candidates. In the 7–8 and 8–9 categories, the decline was about 5% and 7%, respectively. At the extremes, the change was much smaller: minus 1.6% for schools with averages below 6 and close to zero for those with averages above 9.
The recent contraction therefore does not seem to hit all units equally. It is concentrated mainly in the lower-middle results zone. These schools are not always bad enough to trigger an immediate reaction, but neither are they good enough to retain, without difficulty, families who have alternatives. It is possible that some parents are seeking better-rated public schools, private education (although no spectacular increase in the number of private-school students is visible), or units in other localities. The available data do not allow tracking each student’s path, however, so this explanation remains a hypothesis.
Just as important is that the cohorts of very good schools remain almost stable. Units with averages above 9 lost, overall, only 0.2% of candidates between 2024 and 2026. Demand for these schools seems to hold up even when the regional cohort shrinks.
What we can and cannot say from these data
The data show the school and the region where a student sat the National Evaluation. They do not show where the student started 5th grade, whether they transferred in the meantime, whether they moved from public to private, whether the family moved, or whether the student left the system before the exam. For this reason, changes in cohort sizes cannot automatically be interpreted as birth rates, migration, or dropout.
We can still formulate three solid conclusions. First: the 2026 decline is real and important, especially in Bucharest, but it starts from a peak and brings the Capital back close to the 2022 level. Second: in the long run, Bucharest and especially Ilfov have gained candidates and increased their share of the national total. Third: in the recent period, the loss of student numbers is selective and concentrated in lower-middle-performing schools.

